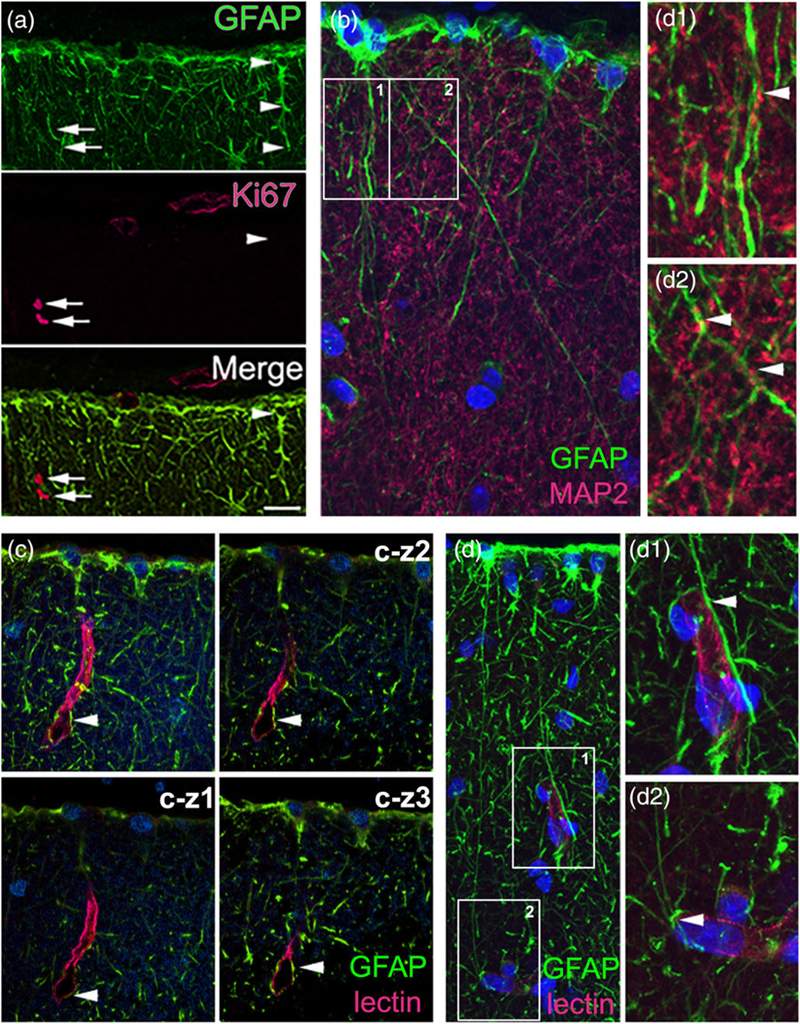
FIGURE 10.

ILA contact neuronal processes and capillaries. Double immunofluorescence staining in Macaca mulatto cerebral cortex. (a) ILA do not express the proliferative marker Ki67. GFAP (green)–Ki67 (red), 60x oil picture, (b) ILA contact neuropil. GFAP (green)–MAP2 (red), 100x oil picture. (b1–2) zoom of white squares in (b). (c, d) ILA contact lectin+ capillaries, 60x and 100x oil pictures, respectively. GFAP (green)–Lectin (red). (c-z1–3) individual images for the Z-stack for (c). (d1–2) zoom of white squares in (d). White arrowheads point to ILA cells in (a), and at GFAP+/MAP2+, and GFAP+/Lectin+ co-localization in (b) and (c,d), respectively. White arrows point to Ki67+/GFAP− cells in (a). Scale bars = (a) 50 μm, (b,d) 10 μm, (c) 20 μm [Color figure can be viewed at wileyonlinelibrary.com]
