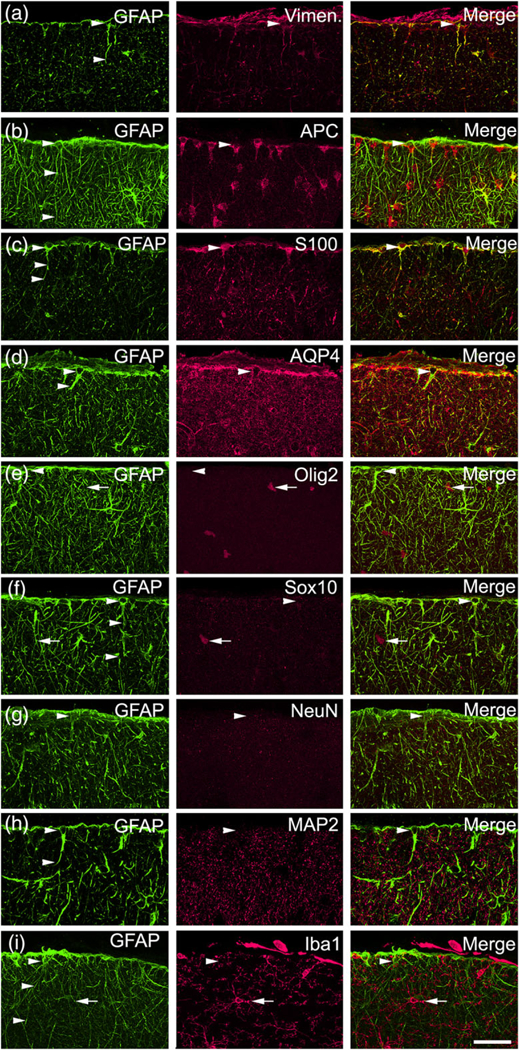
FIGURE 5.

ILA molecular characterization in rhesus macaque (Macaca mulatta) cerebral cortex. ILA express Vimentin, APC, S100β, AQP4, and do not express Olig2, Sox10, NeuN, MAP2, Iba1. (a) GFAP (green)–Vimentin (red), (b) GFAP (green)–APC (red), (c) GFAP (green)–S100β (red), (d) GFAP (green)–AQP4 (red), (e) GFAP (green)–Olig2 (red), (f) GFAP (green)–Sox10 (red), (g) GFAP (green)–NeuN (red), (h) GFAP (green)–MAP2 (red), (i) GFAP (green)–Iba1 (red). White arrowheads point at ILA cells (somata and/or processes), positive for: Vimentin, APC, S100β, AQP4, and negative for: Olig2, Sox10, NeuN, MAP2, Iba1. White arrows pointing at Olig2+ cells (e), Sox10+ cells (f), Iba1+ cells (h). Scale bar = 50 μm [Color figure can be viewed at wileyonlinelibrary.com]
