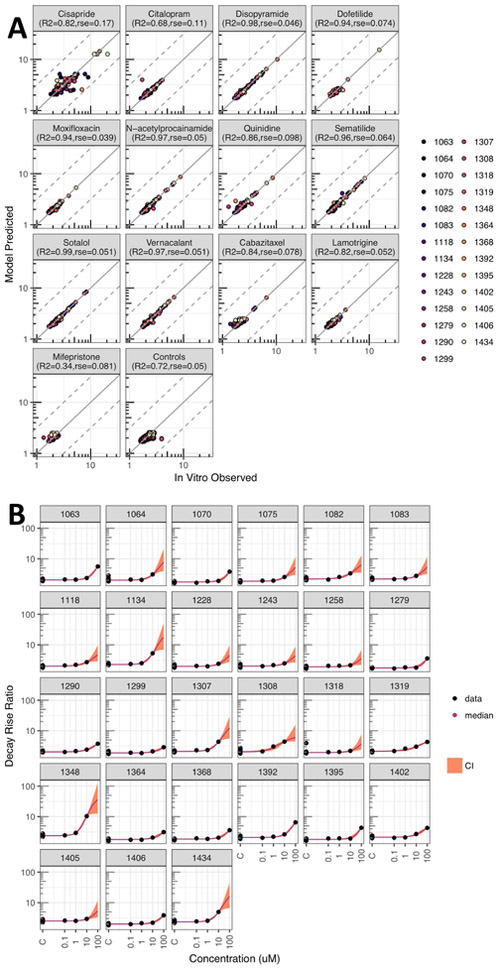
Figure 2. Concentration response modeling results.
(A) Observed in vitro decay-rise ratio data compared to a “random” sample prediction for drugs and controls, each in separate subpanels; different colors denote different individuals. The adjusted R2 and residual standard error (rse) are for predictions vs. data after log10 transformation. (B) Example concentration-response model fit for disopyramide (other in Supplemental Materials) with decay-rise data (black dot); median prediction (colored line) and 95% CI (colored shading).

