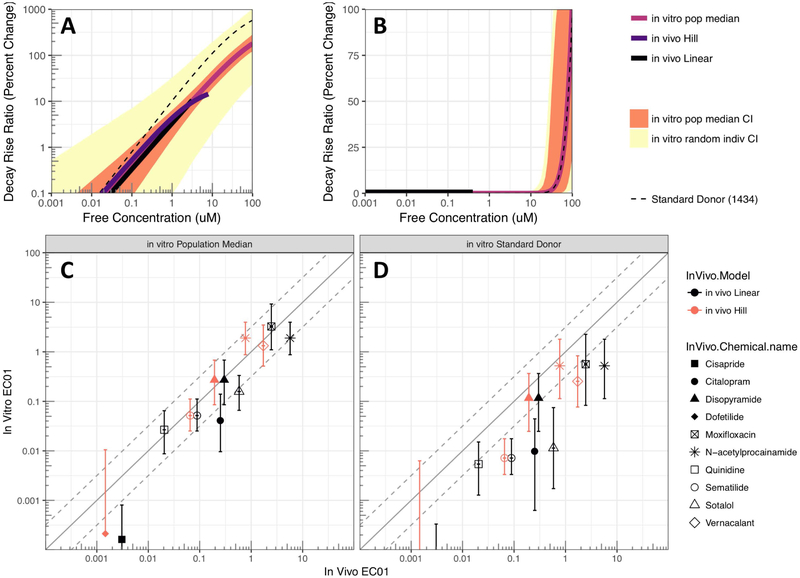
Figure 3. In vivo-in vitro Comparison.
(A-B) Comparison of concentration-response functions based on in vivo data compared to in vitro data for (A) disopyramide (positive control) and (B) cabazitaxel (negative control). Predictions for in vivo response are shown up to clinical Cmax free; in vitro predictions shown include population median, random individual, and standard donor (1434). Results for other chemicals in Supplemental Materials. (C-D) Comparison of in vivo EC01 with in vitro EC01 based on (C) population median and (D) standard donor (1434). Results for EC05, EC10, and response at Cmax are shown in Supplemental Materials.

