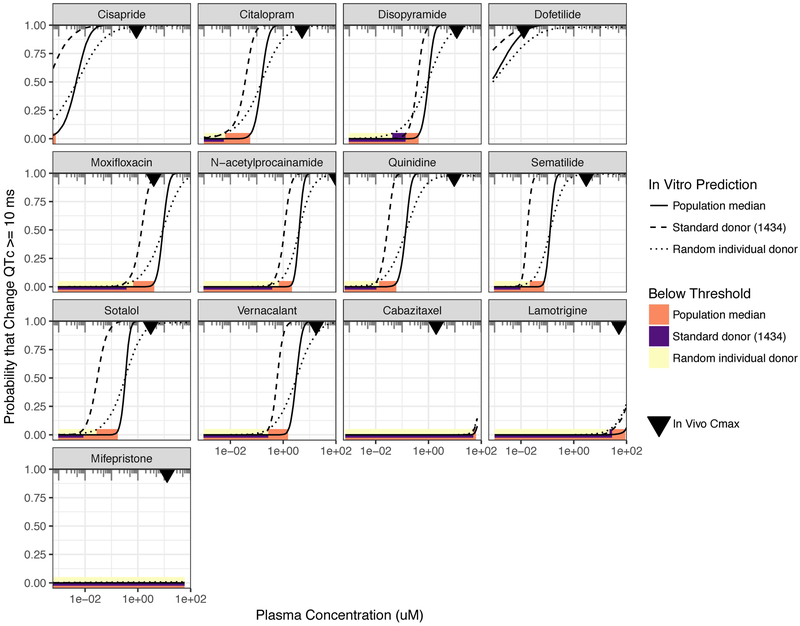
Figure 4. Clinical translation to “Thorough-QT in a dish.”.
In each panel, the probability that QTc is prolonged by 10 ms or more is plotted against drug plasma concentration. The most direct correspondence to the regulatory threshold for a clinical TQT study is the population median response (solid line). For comparison, the probability is also plotted using only the standard donor (1434) (dashed line) as well as for a “random individual donor,” which provide information as to probabilities at the individual-level rather than population-level. For each probability curve, the solid bars (orange=population median; purple=standard donor; yellow=random individual) represent the plasma concentration range over which the regulatory threshold is met (less than 5% probability). The inverted triangle represents the clinical Cmax as reported in in vivo PK-PD studies.

