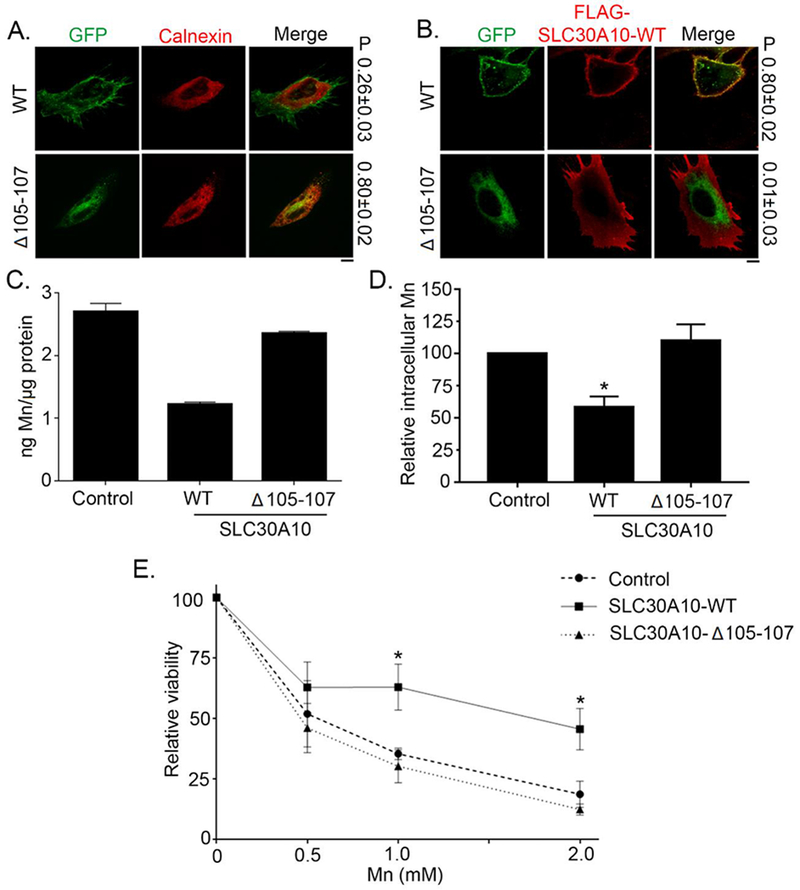
Figure 1. SLC30A10-WT-GFP traffics to the cell surface and protects against Mn toxicity whereas SLC30A10-Δ105-107-GFP is trapped within the endoplasmic reticulum and unable to protect.

(A). HeLa cells were transfected with indicated GFP-tagged SLC30A10 constructs. Two days after transfection, cultures were processed for immunofluorescence. SLC30A10 was detected using GFP fluorescence, and a polyclonal antibody against calnexin was used to demarcate the endoplasmic reticulum. P represents the Pearson’s coefficient for colocalization between GFP and calnexin (mean ± SE; n = 10 cells per SLC30A10 construct). Scale bar, 10 μm. (B). HeLa cells were co-transfected with GFP-tagged SLC30A10-WT or -Δ105-107 constructs and FLAG-tagged SLC30A10-WT. Two days after transfection, cells were processed to detect GFP and FLAG. P represents the Pearson’s coefficient for colocalization between GFP and FLAG (mean ± SE; n = 10 cells per SLC30A10-GFP construct). Scale bar, 10 μm. (C and D). HeLa cells were transfected with a control construct (Rab5-GFP), SLC30A10–WT-GFP or SLC30A10-Δ105-107-GFP. Two days after transfection, cells were treated with 500 μM Mn for 16 h. The absolute level of intracellular Mn was then measured using ICP-MS and normalized to total protein. Data from one representative experiment are depicted in Panel C; error bars depict SD from three ICP-MS runs. Analysis from three independent experiments is presented in Panel D (mean ± SE; * p<0.05 between WT and other groups using one way ANOVA and Tukey Kramer post hoc test). (E). HeLa cells were transfected as described in Panels C and D above. Two days after transfection, cells were treated with indicated amounts of Mn for 16 h. Cell viability was then assessed using the MTT assay. For each transfection condition, viability at 0 mM Mn was set to 100 and used to calculate the percent viability after Mn treatment (mean ± SE; n = 3; *p < 0.05 for the difference between the viability of SLC30A10–WT-expressing cells and other groups at indicated concentrations using two-way ANOVA and Tukey Kramer post hoc test).
