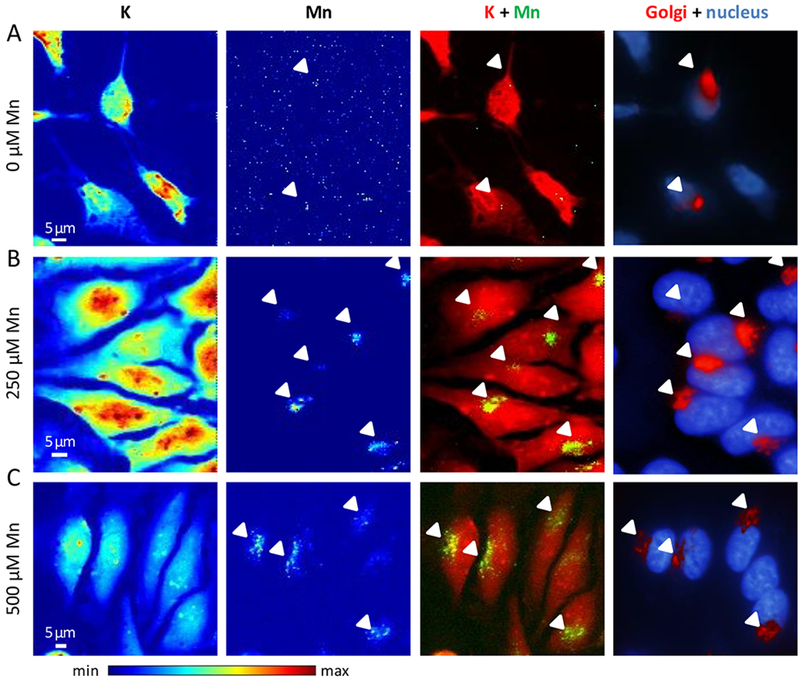
Figure 2. Representative examples of SXRF microprobe imaging of potassium (K) and manganese (Mn) in not transfected HeLa cells, and comparison with the fluorescence microscopy of the Golgi apparatus and the nucleus.

(A) Cells cultured without added Mn, (B) cells exposed to 250 μM Mn, and (C) cells exposed to 500 μM Mn. From left to right panels, K and Mn distributions in cells displayed with a color scale from minimum (blue) to maximum (red) SXRF counts, overlay images of K (red) and Mn (green), and fluorescence microscopy overlay images of nucleus staining (blue) and Golgi apparatus labeling (red). Arrows indicate Mn and Golgi apparatus co-localization.
