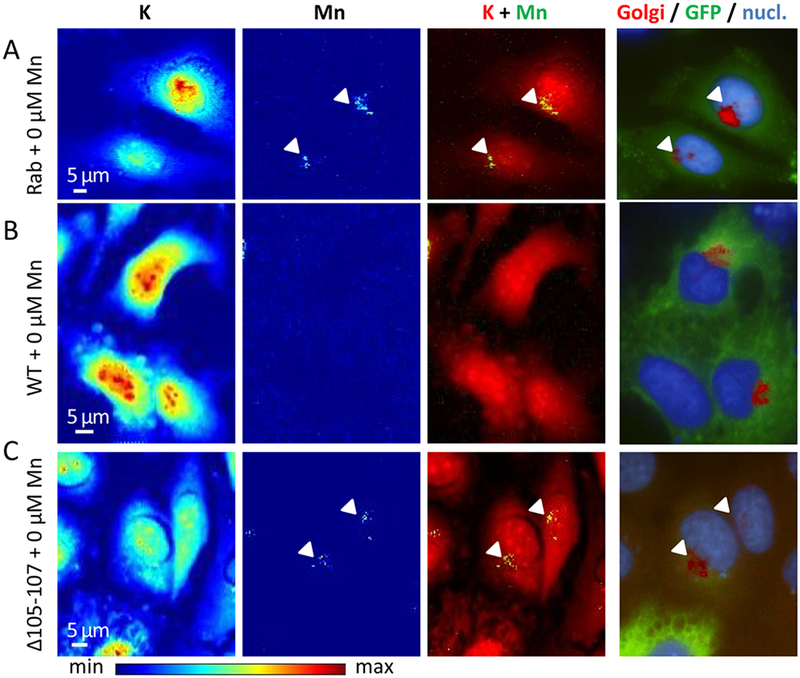
Figure 5. Representative examples of SXRF microprobe imaging of potassium (K) and manganese (Mn) in HeLa cells transfected with indicated constructs exposed to physiological Mn (0 μM added) and comparison with the fluorescence microscopy of the Golgi apparatus and the nucleus.

(A) Cells transfected with GFP-tagged Rab5 construct, (B) cells transfected with GFP-tagged SLC30A10-WT construct, and (C) cells transfected with GFP-tagged SLC30A10-Δ105-107 construct. From left to right panels, K and Mn distributions in cells displayed with a color scale from minimum (blue) to maximum (red) SXRF counts, overlay images of K (red) and Mn (green), fluorescence microscopy overlay images of nucleus staining (blue), Golgi apparatus labeling (red), and GFP-tagged proteins (green). Arrows indicate Mn and Golgi apparatus co-localization.
