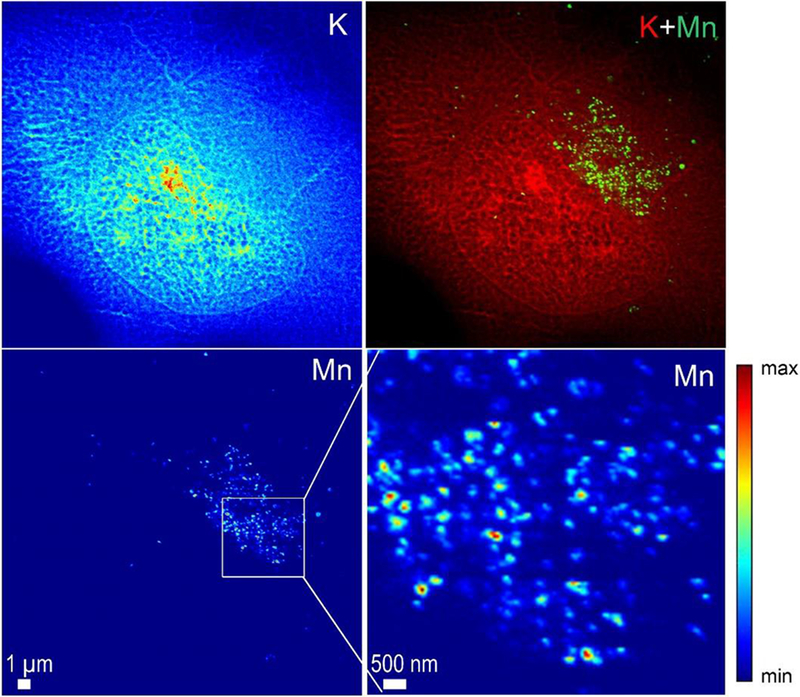
Figure 7. Potassium (K) and manganese (Mn) distributions obtained at high spatial resolution in a cell transfected with SLC30A10-Δ105-107-GFP and exposed to 500 μM Mn.

A zoom in the Mn rich area reveals the punctuated distribution of Mn in single structures as small as the beam size, 50 nm.
