
Figure 8. Potassium (K) and manganese (Mn) distributions obtained at high spatial resolution in a cell transfected with SLC30A10-WT-GFP and exposed to 500 μM Mn.
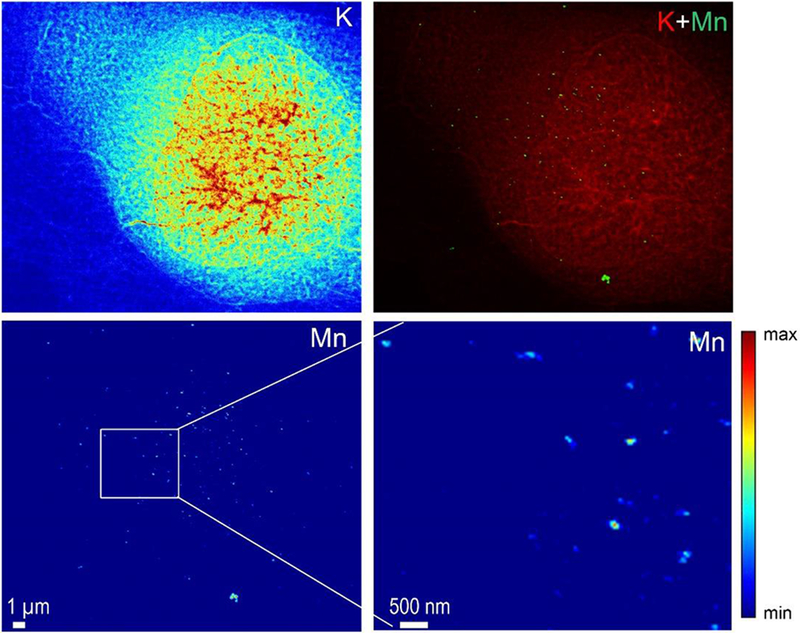
In this case the number of Mn hot spots is lower in the cells expressing the mutant protein and is not restricted to the perinuclear area of the cell.