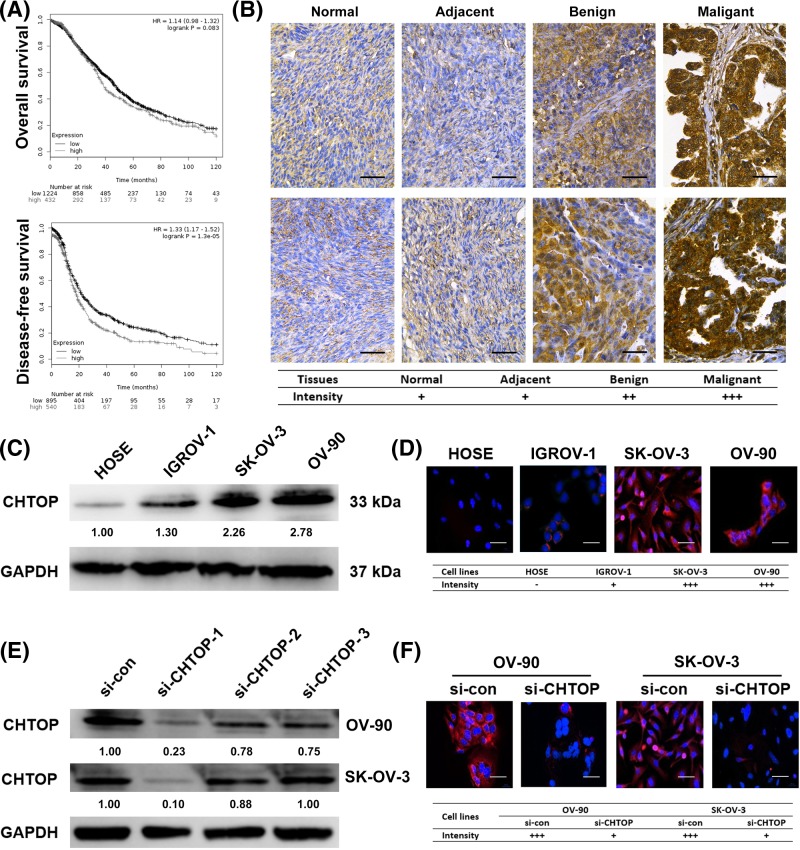
Figure 1. Higher expression of CHTOP was associated with a lower DFS rate and was found in malignant epithelial ovarian cancer cells.
(A) Higher expression of CHTOP was associated with a lower 10-year DFS rate in ovarian cancer patients. (B) CHTOP was highly expressed in human ovarian cancer tissues. Representative immunohistochemical images of normal ovarian tissues, adjacent tissues, and benign and malignant cancer tissues were obtained at 400× magnification. Brown represents CHTOP staining, while blue represents nuclear staining. (C) Compared with normal epithelial ovarian cell line (HOSE), higher protein expression of CHTOP was found in epithelial ovarian cancer cell lines (IGROV-1, OV-90, and SK-OV-3). The protein expression of CHTOP was tested and quantitated by immunoblot analysis and densitometric scan, respectively. GAPDH was used as the loading control. (D) Compared with normal epithelial ovarian cell line (HOSE), higher protein expression of CHTOP was found in epithelial ovarian cancer cell lines (IGROV-1, OV-90, and SK-OV-3). The protein expression of CHTOP was tested by immunofluorescence. Red fluorescence represents CHTOP, while blue fluorescence represents nucleus. Representative images were obtained at 200× magnification, and mean intensity of fluorescence from five randomly selected fields was evaluated. (E) Comparison of CHTOP knockdown efficiency among three CHTOP-targeted siRNAs. The protein expression of CHTOP was tested and quantitated by immunoblot analysis and densitometric scan, respectively. GAPDH was used as the loading control. (F) Effective CHTOP knockdown was confirmed by immunofluorescence. The protein expression of CHTOP was tested by immunofluorescence. Red fluorescence represents CHTOP, while blue fluorescence represents nucleus. Representative images were obtained at 200× magnification, and mean intensity of fluorescence from five randomly selected fields was evaluated.

