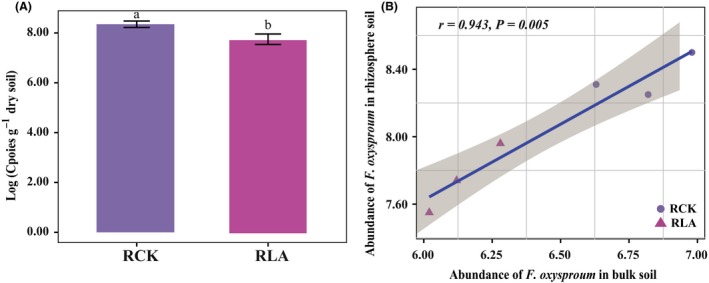
Figure 1.

Histogram of log‐transformed abundance of F. oxysporum in the rhizosphere soils quantified by the qPCR analysis (A). Pearson correlations between abundance of F. oxysproum in bulk soil and abundance of F. oxysproum in rhizosphere soil (B). Bars above the histogram represent standard deviation and different letters indicate a significant difference (P < 0.05) according to two independent sample t‐test. RCK and RLA represent rhizosphere soil sample collected at the end of pot experiment of the LAB treatment and CKB control respectively. CKB, treatment of biofertilizer applied to non‐fumigated control; LAB, treatment of biofertilizer applied to mixture of lime and ammonium bicarbonate fumigated soil.
