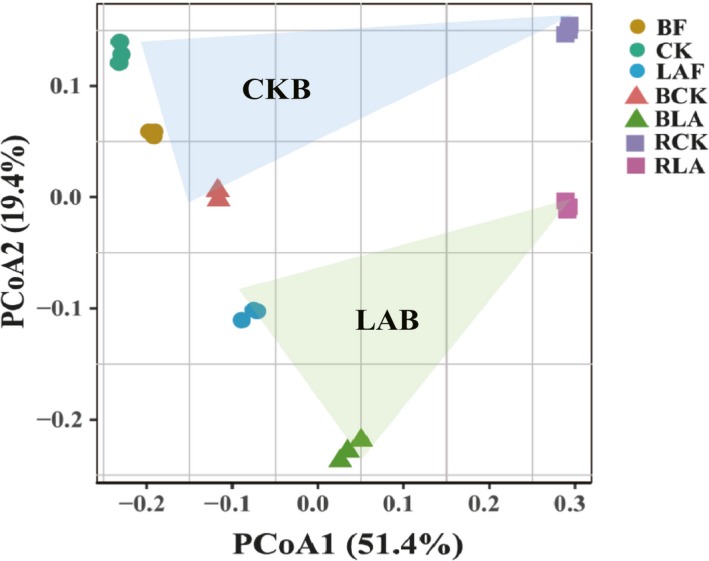
Figure 2.

Principal coordination analysis (PCoA) plots of the bacterial community based on Bray–Curtis distance matrix. BF, CK and LAF represent the original soil samples before fumigation; soil samples were collected from non‐fumigation control and immediately after fumigation with lime and ammonium bicarbonate respectively. BCK and BLA represent bulk soil sample collected at the end of pot experiment of the LAB treatment and non‐fumigation control respectively. RCK and RLA represent rhizosphere soil sample collected at the end of pot experiment of the LAB treatment and CKB control respectively. CKB is treatment of biofertilizer applied to non‐fumigated control. LAB is treatment of biofertilizer applied to mixture of lime and ammonium bicarbonate fumigated soil.
