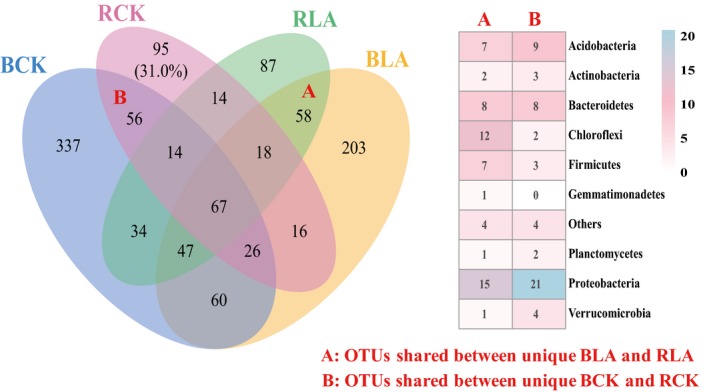
Figure 4.

Venn diagram displaying the differences in the bacterial community composition for the bulk and rhizosphere soil samples collected at banana harvest for different treatments (left panel) (A). Heatmap showing the cumulative counts of OTUs affiliated to each phylum for unique OTUs between rhizosphere and bulk soil samples (B). ‘Others’ indicates phyla with an extremely low abundant. BCK and BLA represent bulk soil sample collected at the end of pot experiment of the LAB treatment and non‐fumigation control respectively. RCK and RLA represent rhizosphere soil sample collected at the end of pot experiment of the LAB treatment and CKB control respectively. CKB is treatment of biofertilizer applied to non‐fumigated control. LAB is treatment of biofertilizer applied to mixture of lime and ammonium bicarbonate fumigated soil.
