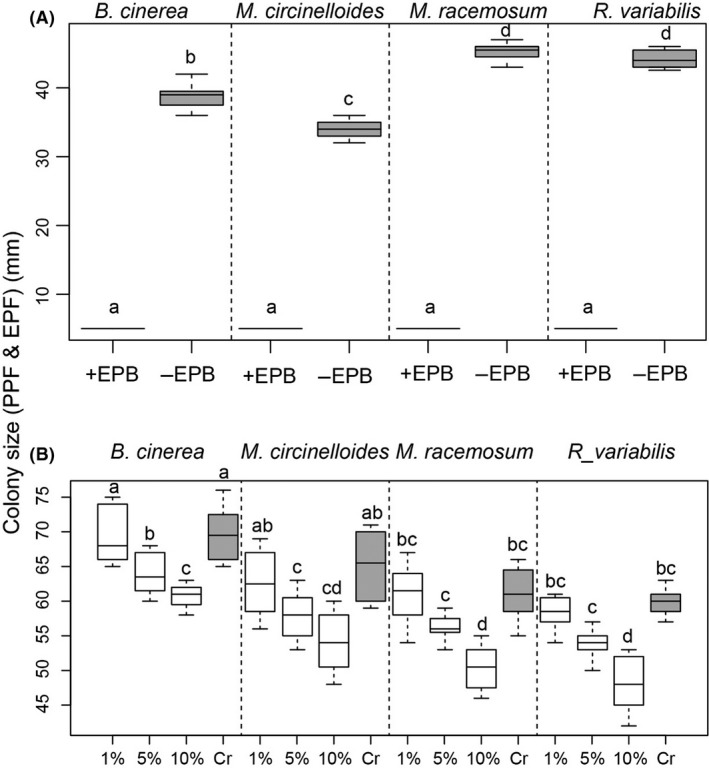
Figure 1.

Colony development (shown as the boxplots of average colony diameter in mm) of PPF Botrytis cinerea, and EPF Mucor circinelloides, M. racemosus and Rhizomucor variabilis in the presence (+EPB), or the absence (−EPB) of Alcaligenes faecalis. Panel (A) shows the effect using whole cell cultures. (Panel B) represents fungal colony developments when in presence of EPB cell‐free filtrates (1%, 5% and 10% dilution of the initial filtrate. Grey boxes represent the control without EPBs. Letters above boxplots indicate significant difference among treatments and species (P ≤ 0.05, Turkey HSD).
