
Figure 2.
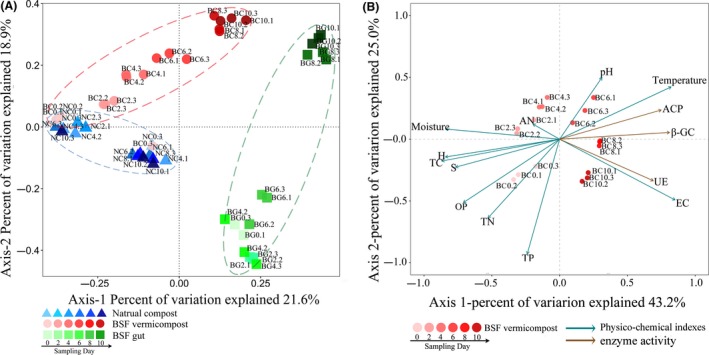
A. PCoA plots based on weighted UniFrac distances of samples collected from natural composting (i.e. NC without larvae inoculation), BSF vermicomposting (i.g., BC) and BSF gut samples (i.e. BG). The colour depth indicates the sampling days. Points of the same depth and colour represent three parallel samples taken on the same sampling day.
B. Redundancy analysis (RDA) of environmental variables in BC. Abbreviations are shown as: ACP (Acid phosphatase), β‐GC (β‐glucosidase), UE (Urease), EC (Electric conductivity), TP (Total phosphorus), TN (Total nitrogen), OP (Olsen phosphorus), TC (Total carbon), AN (Ammonia nitrogen).