
Figure 3.
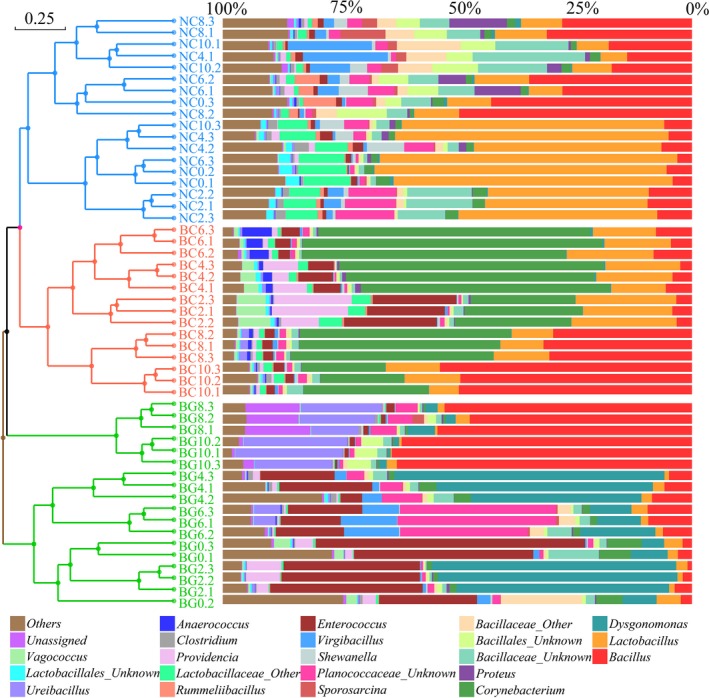
Relative abundance (%) of taxa at the genus level, clustered using UPGMA on the weighted UniFrac distances (Bray‐Curtis). Taxa with < 1% of reads were combined together as ‘Others’; while ‘Unassigned’ represents unclassified taxa at the genus level (Table S2).