
Figure 6.
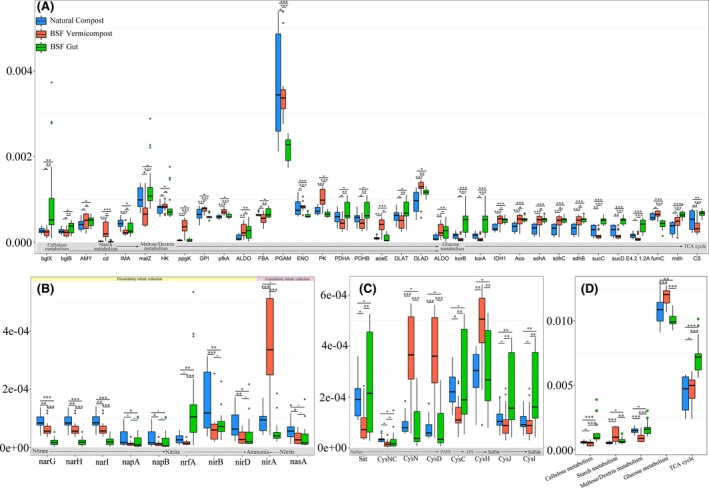
Box‐plots of relative genes abundance based on KEGG database.
A. Functional genes related to carbon metabolism; (B) Functional genes related to nitrogen metabolism; (C) Functional genes related to sulphur metabolism; (D) Genes related to different steps of carbon metabolism. The circles above or below the box‐plots indicate Outlier. – p > 0.05; *p < 0.05; **p < 0.01; ***p < 0.001.