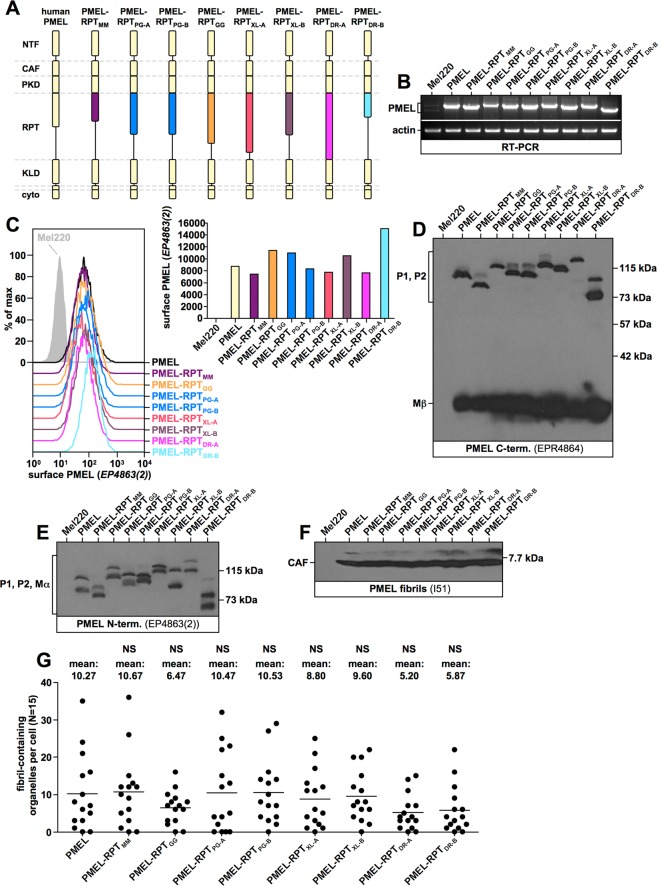
Figure 6.
Fibril formation by PMEL RPT domain swapping mutants. (A) Schematic representation of the various chimeric PMEL mutants analyzed. Mutants are based on human PMEL and contain the RPT domain from mouse PMEL (PMEL-RPTMM), corn snake PMEL allele A (PMEL-RPTPG-A), corn snake PMEL allele B (PMEL-RPTPG-B), chicken PMEL (PMEL-RPTGG), xenopus laevis PMEL-A (PMEL-RPTXL-A), xenopus laevis PMEL-B (PMEL-RPTXL-B), zebrafish PMEL-A (PMEL-RPTDR-A), or zebrafish PMEL-B (PMEL-RPTDR-B). (B) Confirmation of PMEL construct expression in Mel220 cells by semi-quantitative RT-PCR. The primers used are vector-specific primers amplifying the entire PMEL open reading frame. The same primers were used for all constructs to allow cross-comparability. (C) Flow cytometry analysis of the surface expression of PMEL chimeric constructs. Results are depicted as histograms (left panel) or in form of a bar diagram (right panel). (D–F) Western blot analysis of SDS-lysed total membranes using PMEL-specific antibodies EPR4864 (PMEL C-term.) (D), EP4863(2) (PMEL N-term.) (E), and I51 (CAF) (F). Lanes in Fig. 6D contain three bands (a highly intense, low molecular weight form corresponding to the C-terminal Mβ fragment (∼27 kDa), an intermediate intensity, middle band corresponding to the immature ER form P1 (∼100 kDa in human PMEL), and a topmost weak band, running slightly slower and corresponding to the Golgi form P2 (∼120 kDa in human PMEL). P2 is not visible for all constructs in this exposure. Lanes in Fig. 6E also contain three bands. The lowest molecular weight form corresponds to the N-terminal Mα fragment (∼85 kDa in human PMEL), the middle band corresponds to P1, and the topmost weak band corresponds to P2. P2 is not visible for all constructs in this exposure. (G) Quantitative EM analysis of Mel220 transfectants showing the number of fibril-containing organelles per cell [N = 15]. A One-Way ANOVA with Dunnett’s post test was used to determine whether means are statistically different from the human PMEL sample (NS, not significant). Representative electron micrographs are depicted in Fig. 7B.

