Fig. 2.
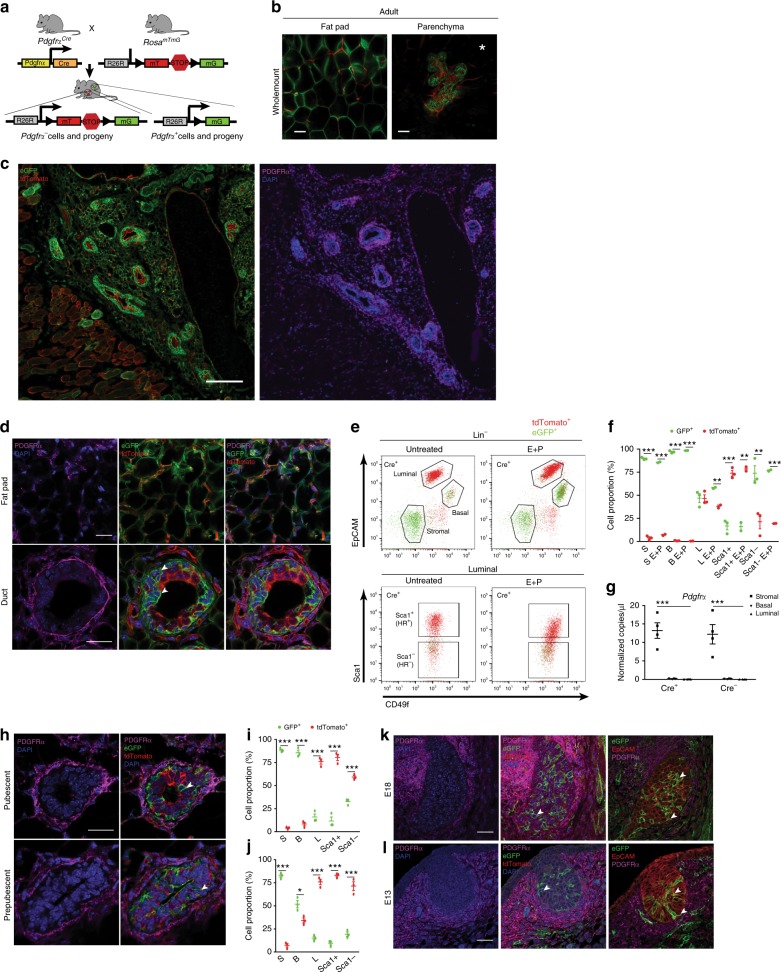
Lineage tracing Pdgfrα+ mesenchymal cells reveals GFP-labeled progeny within the mammary epithelium. a Lineage tracing model used to determine stromal cell dynamics in the mammary gland. b Whole mount confocal images of native GFP (green) and tdTomato (red) fluorescence in the mammary fat pad (left) and epithelia (right; E+P treated) of adult PdgfrαCre R26mTmG mice; scale bar = 50 µm. c GFP, tdTomato (left) and PDGFRα (magenta), DAPI (blue) (right) immunostaining spanning several epithelial structures in PdgfrαCre R26mTmG mammary tissue derived from b; scale bar = 200 µm. d High magnification image of PDGFRα, GFP and tdTomato in the fat pad and glandular regions from an E+P treated mouse (representative of n = 5 adult mice and 5 fields per tissue section); scale bar = 25 µm. e FACS profiles of GFP+ and tdTomato+ cells in mammary subpopulations: stromal, basal, luminal and luminal subsets enriched for hormone receptor (HR) positive (Sca1+) and negative (Sca1-) cells of adult mammary glands isolated from untreated (n = 3) or E+P treated (n = 2) mice; f Quantification of GFP+ and tdTomato+ cells in stromal (S), basal (B) and luminal (L) subpopulations shown in e. g Droplet digital PCR analysis of Pdgfrα transcripts normalized to Gapdh in FACS-sorted mammary cell fractions from lineage tracing mice (n = 4 per group). h Immunofluorescent images of PdgfrαCre R26mTmG mammary tissue sections from pubescent and prepubescent mice (imaging of n = 3 mice per stage and 5 fields per tissue section); scale bar = 25 µm. Quantification of GFP+ and tdTomato+ cells in mammary subsets of i pubescent (n = 3) and j prepubescent (n = 3) mice. PDGFRα+ cells (magenta), GFP+ progeny (green) and epithelial EpCAM (red) in the embryonic mammary gland at embryonic day 18 k and day 13 l (n = 3 mice each, 3 fields per tissue section); scale bar = 25 µm. White arrowheads indicate GFP+ cells. White asterisk denotes associated Supplementary Movie 1. Data represent mean ± s.e.m. *p< 0.05, **p<0.01,***p<0.001 (Statistical analysis by one-way ANOVA in g and t-test in f, i and j). Source data are provided as a Source Data file

