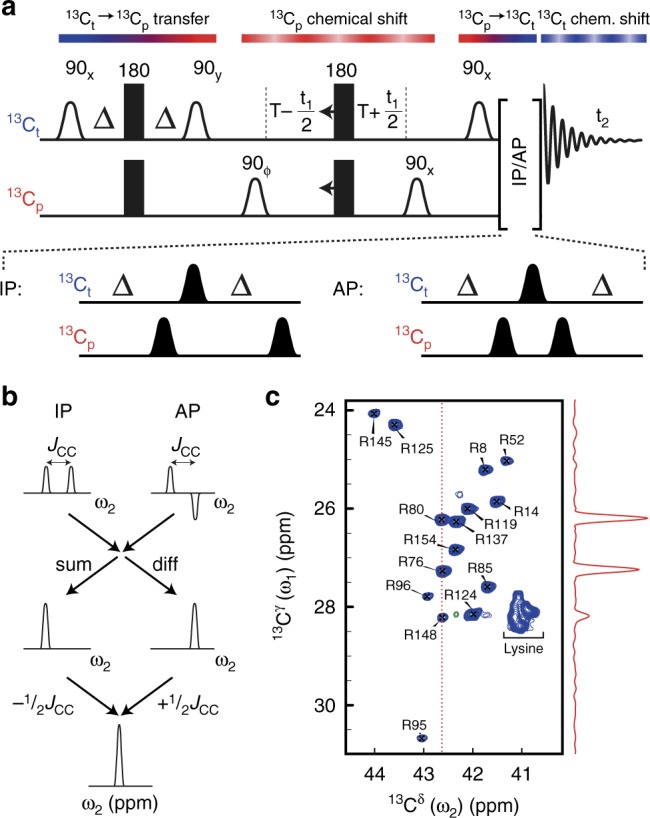
Fig. 2.

13C–13C side-chain correlation spectra of per-deuterated proteins. a Schematic representation of the NMR pulse sequence used to obtain 13C–13C side-chain correlation spectra. The flow of the magnetisation between 13Ct (blue) and 13Cp (red) is shown above the sequence with colour gradients. The following delays are used: Δ = 1/(4JCC) ≈ 7.1 ms, T = 1/(2JCC) ≈ 14.1 ms, where JCC is the one-bond 13C–13C scalar coupling constant. Rectangular pulses are high-power and not selective, bell-shaped pulses are frequency selective (90°: white outlined, 180°: black). Deuterium, 2H, is decoupled throughout the sequence and frequency discrimination is obtained by states–TPPI of phase ϕ21. b Schematic representation of post-processing to obtain the decoupled spectrum. c Arginine 13Cδ–13Cγ correlation of the 18-kDa protein T4L L99A, obtained on a 1.4 mM sample at a static field of 14.1 T at 278 K in 37 min
