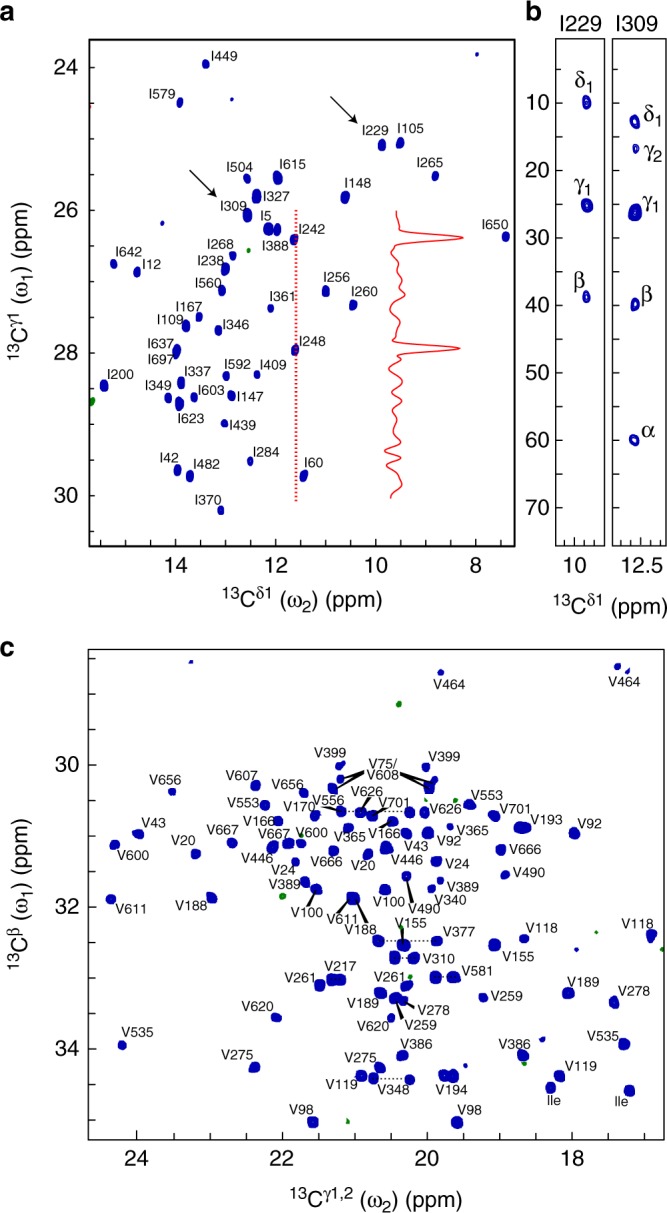
Fig. 3.

13C–13C side-chain correlation spectra of a large protein. a Isoleucine 13Cδ1–13Cγ1 and c valine 13Cγ–13Cβ correlation spectra of a 0.5 mM sample of the 82-kDa protein MSG. Each of the two spectra in a and c were recorded in 7.5 h at 18.8 T using a standard helium-cooled Bruker TCI radio-frequency probe. b Correlating the 13Cδ1–13Cγ1 of isoleucine with the rest of the side chain 13C for chemical shift assignment. Representative TOCSY strips from a three-dimensional 13C-detected CC-TOCSY experiment (see Supplementary Fig. 8) for I229 and I309 (marked with black arrows in a. Chemical shift assignments in a and c were obtained from (refs. 26,27) combined with the 3D-CC-TOCSY. Peaks labelled Ile in c are isoleucine 13Cγ2–13Cβ correlations. All experimental parameters are given in Supplementary Materials and Methods
