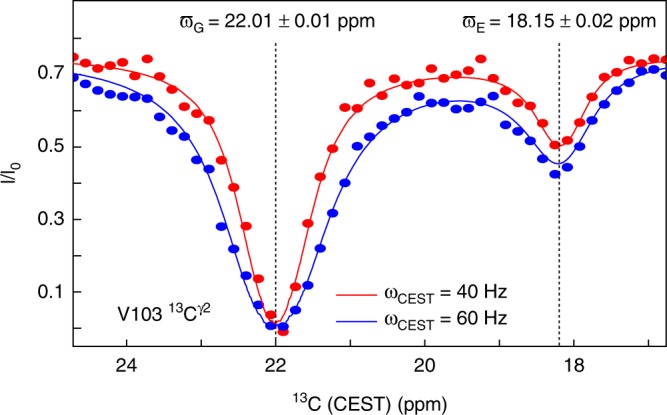
Fig. 4.

Quantifying side-chain motions on the millisecond timescale. CEST profiles to quantify millisecond chemical exchange of V103 13Cγ2 in T4L L99A at 278 K are shown. The circles represent experimentally obtained normalised intensities, and the lines are the result of a least-squares fit. Uncertainties in the reported ϖG and ϖE are obtained using the covariance method in the least-squares fit (see Materials and Methods for full details)
