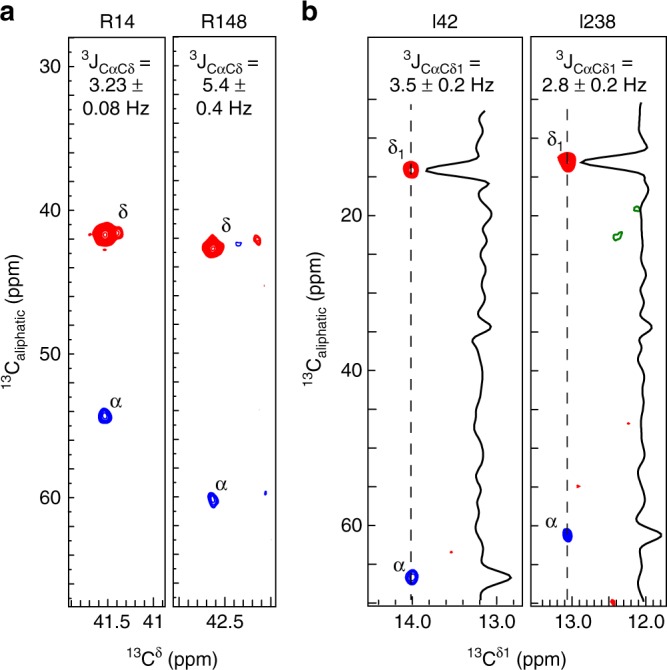
Fig. 5.

Quantifying long-range scalar 13C–13C couplings. a Two examples of strips used to quantify long-range 13Cδ–13Cα scalar couplings in the arginine side chains of T4L L99A at 18.8 T and 278 K. The R14 side chain is flexible, while the R148 is rigid in agreement with relaxation measurements6. b Strips from a three-dimensional experiment to quantify long-range 13Cδ1–13Cα scalar couplings in isoleucine side chains of the 82-kDa MSG at 14.1 T and 310 K. The I238 side chain is dynamic around the χ2 angle, as seen by the intermediate value of the 3JCαCδ1 coupling constant, whereas I42 is more rigid in a trans conformation. Positive contours are depicted as red, while negative contours are in blue. Values for 3JCαCδ1 in a and b are mean ± s.d.
