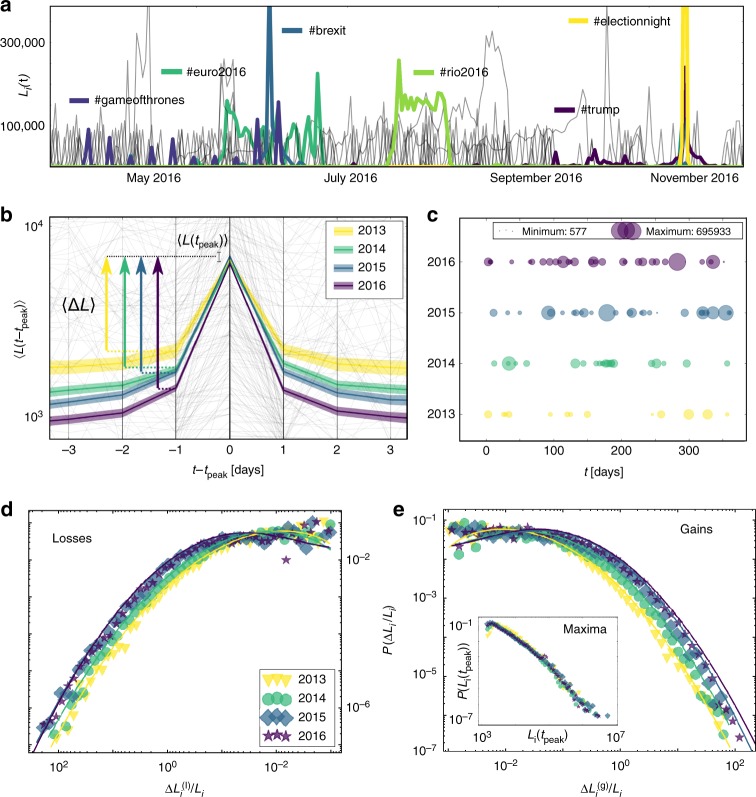
Fig. 1.
Measuring the speed of hashtag dynamics: a Daily usage Li(t) of the top 50 hashtags i on Twitter in 2016, with exemplary highlighted major events. b Average trajectories 〈L(t − tpeak)〉 leading to a local maximum Li(tpeak) in all top hashtags from 2013 to 2016. The shaded area shows the 95% confidence intervals (CI). In the background a 1% random sample of trajectories is shown in grey. c Temporal density of extreme events (local maxima with a lower threshold for the slopes, for details see Methods section), scattered over 365 days. d Distribution of daily relative losses and e daily relative gains . The solid lines show fitted log-normal distributions (distributions truncated at 10−3). Inset: The corresponding distributions of the local maxima of each hashtag trajectory P(Li(tpeak)) (distributions truncated at 103). Source data are provided as a Source Data file and in an online repository (see data availability statement)

