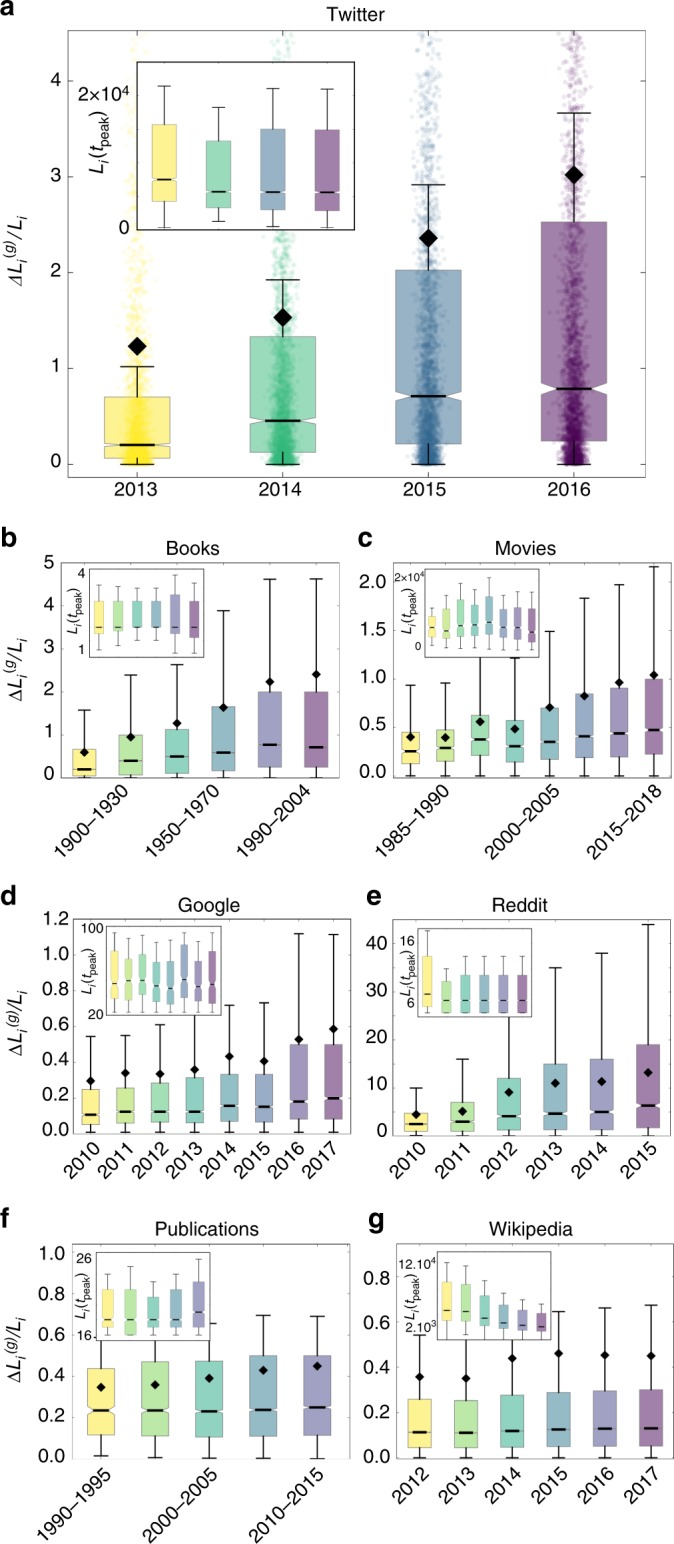
Fig. 2.

Box-plot representation of relative gains in different data sets: The values of the relative gains , shown in a box-and-whisker representation for a Twitter, b Books, c Movies, d Google, e Reddit, f Publications, and g Wikipedia. The median is shown as a black bar and the mean as a black diamond. Whiskers are chosen to show the 1.5 of the interquartile range. In a the data points are included for illustration, in the other plots they are not shown. The insets show the same representation of the peak values Li(tpeak) over the same time intervals (without mean value). Source data are provided as a Source Data file
