Fig. 3.
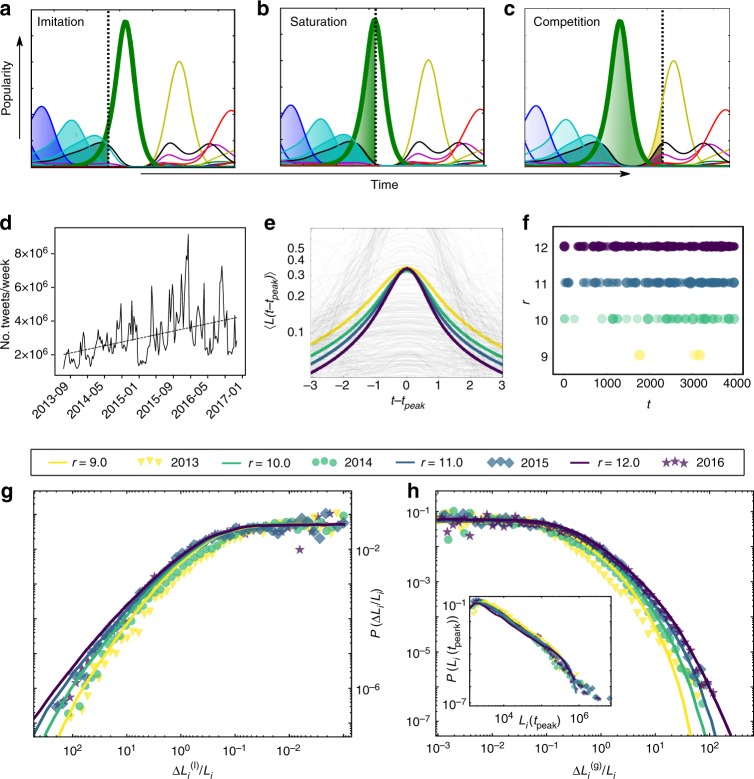
Modeling attention dynamics: a–c Exemplary details of trajectories resulting from Eq. (1), imitation, saturation and competition. d Total amount of tweets observed per week that contain hashtags among the 50 most commonly used hashtags. Their number grows from two million in late 2013 to four million by the end of 2016. e Average trajectories 〈L(t − tpeak)〉 leading to a local maximum Li(tpeak) from the numerical solution of Eq. (1) with α = 0.005, c = 2.4 and N = 300 and varying rc = rp = r from 9.0 in yellow to 12.0 in dark blue, as indicated in the legend. f Intensity of bursts and timing. The radii of the circles encode the height of the peaks of extreme events. g Distribution of losses from the simulations (lines), compared with the empirical data from Twitter (symbols) and h distribution of gains (distributions truncated at 10−3). The inset shows the overlap of the distributions of peak heights P(Li(tpeak)) (simulated values are rescaled and truncated at 103)

