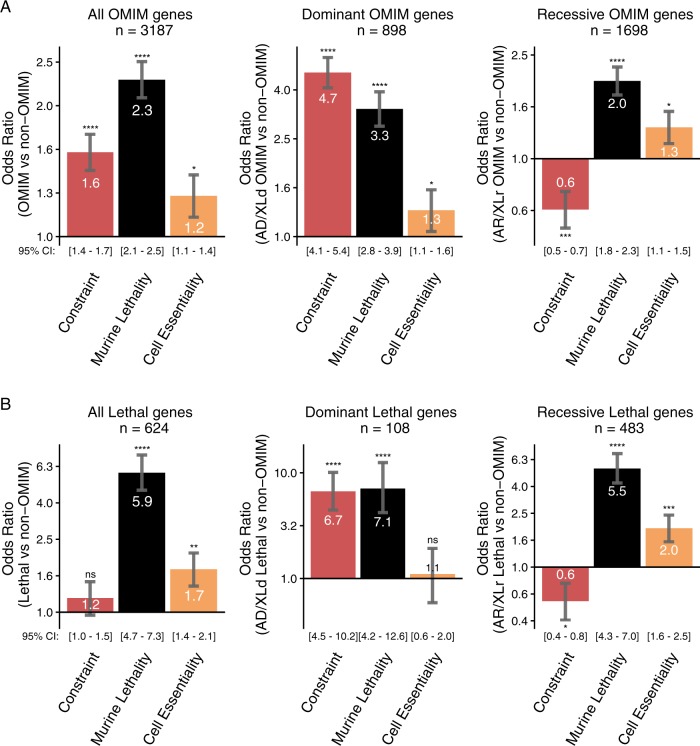
Fig. 6.
Odds ratio (OR) analyses synthesising relevance of scores of genetic cosntraint and model organism phenotypic data, with likelihood of being a disease gene. a All OMIM genes. b 624 Human-lethal disease genes. Red bars: murine lethality. Black bars: genetic constraint. Orange bars: cell essentiality. Odds-ratio statistical significance determined via Fishers two-sided exact test. Numbers in brackets represent the 95% confidence interval for each value. Maximum statistical significance determined in R is p < 2.2 × 10⁻¹⁶. Thus: ****p < 2.2 × 10⁻¹⁶; ***p < 5.0 × 10⁻⁷; **p < 5.0 × 10⁻⁵; *p < 5.0 × 10⁻²

