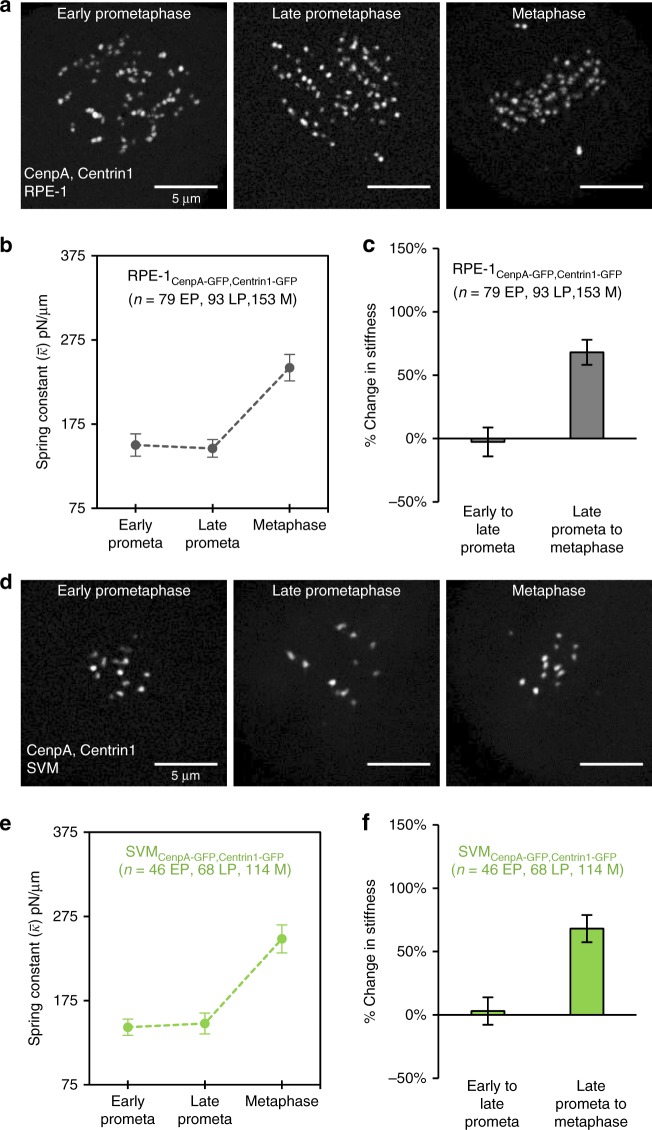
Fig. 2.
Stiffness of the centromere-spring matures during mitotic progression. a Live cell imaging of human RPE-1 cells expressing CenpA-GFP at the outer centromere and Centrin1-GFP at the spindle poles. Images are maximum intensity projections from full-cell-volume image series, and are representative of the described mitotic stages: early-prometaphase (left), late-prometaphase (center), and metaphase (right). b Mean spring constant by mitotic stage for RPE-1 cells (early-prometaphase = 79 chromosomes, 39 cells; late-prometaphase = 93 chromosomes, 26 cells; metaphase = 153 chromosomes, 49 cells). c Percent change in mean stiffness of the centromere-spring between early- and late-prometaphase (left) and late-prometaphase and metaphase (right) for RPE-1 cells. Percentages calculated using data shown in 2B. d Live cell imaging of Indian muntjac SVM cells expressing CenpA-GFP at the outer centromere and Centrin1-GFP at the spindle poles. Images as described in a. e Mean spring constant by mitotic stage for SVM cells. f Percent change in mean stiffness of the centromere-spring between early- and late-prometaphase (left) and late-prometaphase and metaphase (right) for SVM cells. Percentages calculated using data shown in e. The scale bar for all images is 5 μm. All error bars represent standard error. All n-values listed are chromosome numbers. See also Supplementary Figs. 1 and 6

