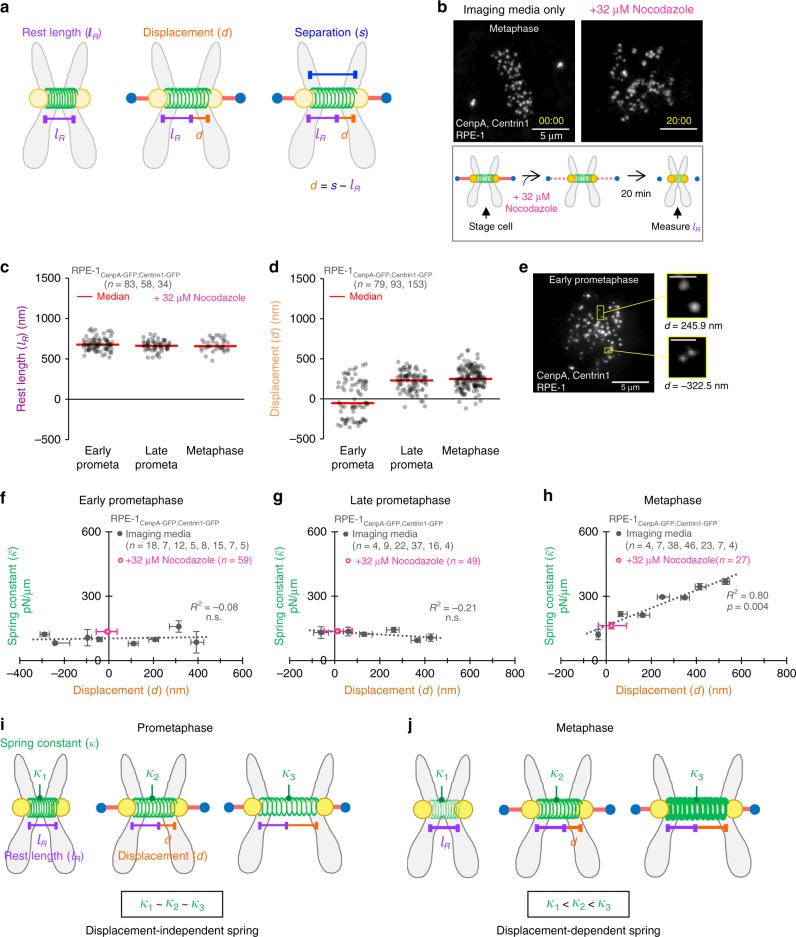
Fig. 4.
Centromere-spring stiffness is displacement-dependent at metaphase. a Schematic representation of the relationship between the rest length of the centromere-spring (); centromere-spring displacement (d); and sister centromere separation (s). b Top: Live cell imaging of a metaphase RPE-1 cell before (left) and 20 min after (right) addition of nocodazole to a final concentration of 32 μM. Scale bar, 5 μm. Bottom: graphical representation of experimental sequence. c Quantification of the rest length of the centromere-spring (), by mitotic stage for RPE-1 cells. Data points reflect individual chromosome data points pooled across three independent experiments; the group median is shown in red. d Quantification of the centromere-spring’s displacement by mitotic stage for each of the RPE-1 chromosomes used in the spring constant analysis (Fig. 2b). Data points reflect individual chromosomes; the group median is shown in red. e Left: Live cell imaging of an early-prometaphase RPE-1 cell. Scale bar, 5 μm. Right: Sister centromere pairs demonstrating the range in centromere displacement values for chromosomes in a single cell at early-prometaphase. Scale bars, 1 μm. f–h The relationship between the centromere-spring displacement and its spring constant at early-prometaphase (f), late-prometaphase (g), and metaphase (h) for RPE-1 cells. Chromosomes were subgrouped by displacement in 100 nm intervals starting at the group minimum. Only subgroups with four or more chromosomes are shown. Each data point reflects the subgroup’s median displacement and mean spring constant; X-axis error bars represent IQR; Y-axis error bars represent standard error. The least-squares regression fit is indicated by the dotted line. Exact p values from linear regression fit are shown for models meeting statistical significance; all others are indicated as non-significant (n.s.). Data for the nocodazole-treated metaphase chromosomes are shown (g, magenta data point), but not included in the regression fit. i, j Model illustrating the relationship between displacement of the centromere-spring and its stiffness during mitotic progression. During early- and late-prometaphase (i), the stiffness of the centromere-spring is displacement-independent. At metaphase (j), the stiffness of the centromere-spring becomes displacement-dependent. All n-values listed are chromosome numbers

