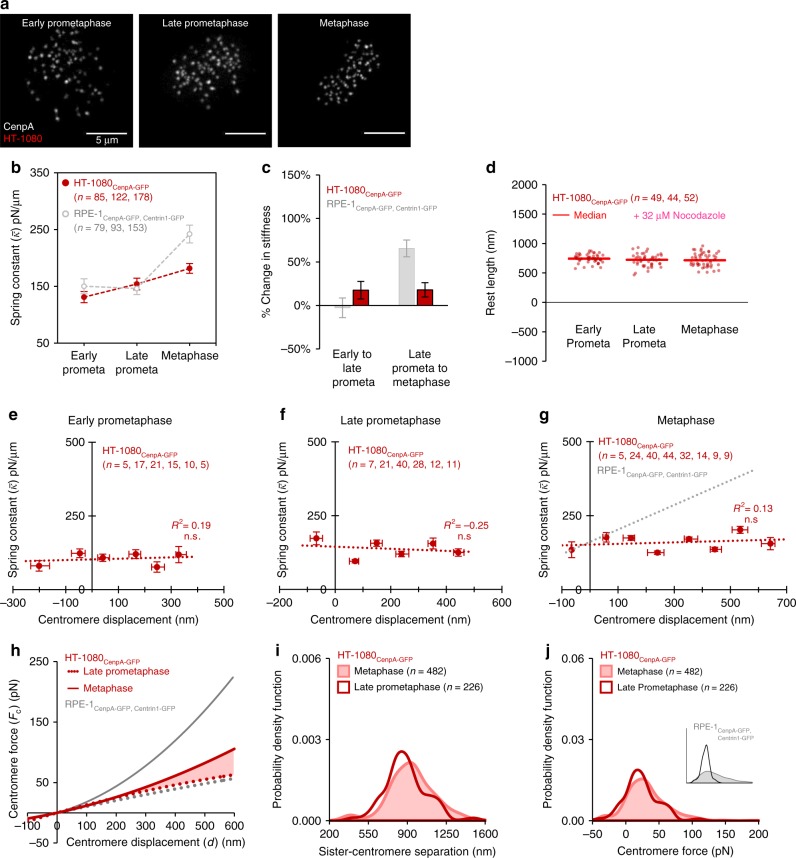
Fig. 6.
Mechanical maturation of the centromere is altered in cancer cells. a Live cell imaging of HT-1080 cells expressing CenpA-GFP at the outer centromere. Images are maximum intensity projections from full-cell-volume image series, and are representative of the described mitotic stages: early-prometaphase (left), late-prometaphase (center), and metaphase (right). Scale bar, 5 μm. b, c Mean spring constant by mitotic stage for HT-1080 cells (b, red) and the percent change in the mean stiffness of the centromere-spring across mitotic stages (c, red; all n-values as in panel b). Data from RPE-1 cells included for comparison (b, c; gray). Error bars represent standard error. d Quantification of the centromere-spring rest length by mitotic stage for HT-1080 cells. Data points reflect individual chromosome data points pooled across three independent experiments, the group median is shown in red. e–g Relationship between the displacement of the centromere-spring and its stiffness at early-prometaphase (e), late-prometaphase (f), and metaphase (g) for HT-1080 cells. Chromosomes were subgrouped by displacement in 100 nm intervals starting at the group minimum. Only subgroups with four or more chromosomes are shown. Each data point reflects the subgroup’s median displacement and mean spring constant; X-axis error bars represent IQR and Y-axis error bars represent standard error. The least-squares regression fit is indicated by the dotted line. Exact p values from linear regression fit are shown for models meeting statistical significance, all others are indicated as non-significant (n.s.). The least-squares regression fit line for RPE-1 chromosomes at metaphase is shown for comparison (g, dotted gray line). h The dynamic range in force transmission for a late-prometaphase chromosome (dotted red line) versus a metaphase chromosome (solid red line) for HT-1080 cells. The shaded region reflects the increase in dynamic range ( + 49.3%) between late-prometaphase and metaphase. The dynamic range for a RPE-1 chromosome at late-prometaphase (dotted line) and metaphase (solid line) are shown in gray for comparison. i, j Probability density functions for individual observations of i sister centromere separation (s) and j centromere force (FC) at late-prometaphase (dark red line) and metaphase (light red line, shaded area) for HT-1080 cells. Inset: RPE-1 centromere force distributions at late-prometaphase (black line) and metaphase (gray line, shaded area) are shown for comparison. All n-values listed are chromosome numbers

