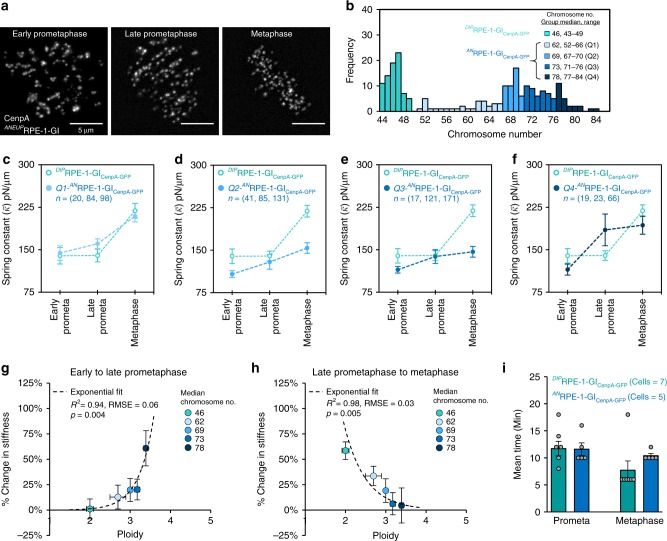
Fig. 8.
Aneuploidy impairs centromere mechanical maturation. a Live cell imaging of ANRPE-1-GI cells expressing CenpA-GFP at the outer centromere. Images are maximum intensity projections from full-cell-volume image series, and are representative of the described mitotic stages: early-prometaphase (left), late-prometaphase (center), and metaphase (right). b Histogram of chromosome numbers for a sample of RPE-1-GI cells differentiating between diploid cells and aneuploid cells. ANRPE-1-GI cells are also subgrouped by quartile (Q1, light blue–Q4, dark blue = 48, = 80, = 110). c–f Mean spring constant by mitotic stage for ANRPE-1-GI chromosomes by quartile of increasing chromosome numbers as in panel b (Q1, light blue filled data point–Q4, dark blue filled data point). Data from DIPRPE-1-GI cells included for comparison (green unfilled data points; n = 131 EP, 136 LP, 178 M, all panels). Error bars represent standard error. All n-values listed are chromosome numbers. g, h Relationship between percent change in mean stiffness from g early to late-prometaphase or h late-prometaphase to metaphase and cell ploidy for RPE-1-GI cells. Data points include DIPRPE-1-GI cells (green) and ANRPE-1-GI cells by quartile (Q1, light blue–Q4, dark blue). X-axis error bars represent IQR; Y-axis error bars represent standard error. Fit to an exponential regression model is indicated by the dashed-line and the listed R2, RMSE, and p-values. i Comparison of mean mitotic timing between DIPRPE-1-GI cells (teal) and ANRPE-1-GI cells (blue). Sample sizes (n) reflect the number of cells in each group. Error bars represent standard error; dots represent individual cells. See also Supplementary Figs. 5 and 7

