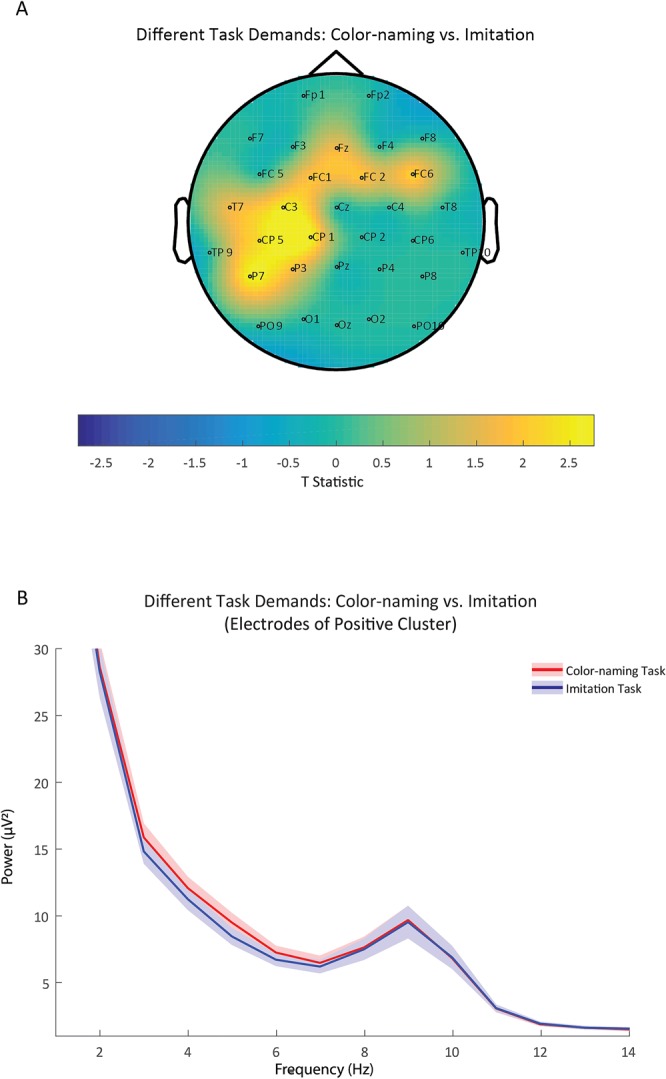
Figure 3.

Panel A illustrates the topography of the results as determined by the cluster-based permutation test contrasting the Color-naming and Imitation Task conditions. As indicated by the warmer colors on the spectrum (reflecting the t statistic, with critical t values at +/−2.052), the difference was most pronounced at the fronto-temporal electrode sites. The topography shows the effect to be predominantly left-lateralized. That is, theta power (3–6 Hz) measured at these sites (Fz, FC1, FC2, FC6, T7, C3, CP5, CP1, P7, P3) was significantly higher in the Color-naming than in the Imitation Task condition. Note that this comparison is based on the action clip period. Panel B displays power values as a function of frequency (Hz) separately for the Color-naming (red) and Imitation Task (blue) condition. Power values are averaged across electrode sites of the positive cluster (Fz, FC1, FC2, FC6, T7, C3, CP5, CP1, P7, P3). Shaded areas represent the standard error of power values.
