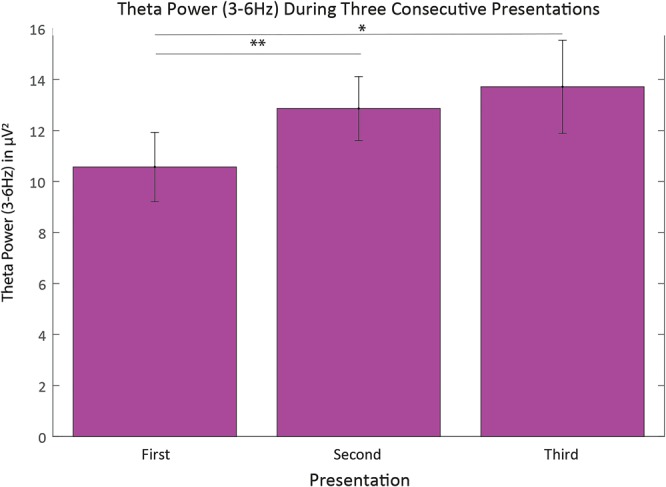
Figure 4.

Bar graph representation of theta power (3–6 Hz) in the first, second, and third presentation of the fixation cross during the task block (i.e. Color-naming and Imitation Task), with *indicating p < 0.05 and **indicating p < 0.025. Note that this comparison is based on the fixation cross period and includes only the subset of participants who contributed data to all of the three presentations. Vertical error bars represent the standard error.
