Fig. 1.
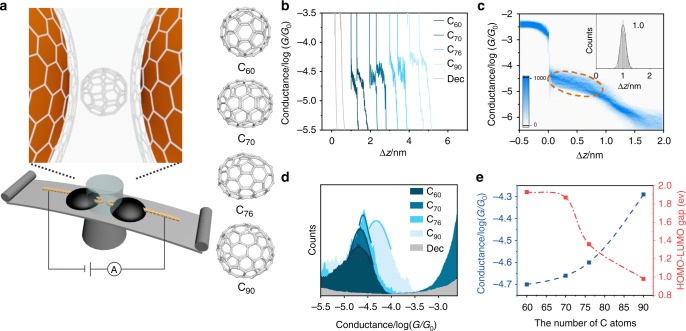
Conductance measurement of graphene/single-fullerene/graphene junctions. a Schematic of mechanically controlled break junction and graphene/single-fullerene/graphene junction and chemical structure of C60, C70, C76, and C90. b Typical individual conductance–displacement curves for graphene/blank or single-C60, C70, C76, and C90/graphene junctions. c Two-dimensional conductance histogram of single-C60 junction obtained from ~1700 traces, the high trigger was set as 3.2 × 10⁻³ G0 (G0 is the quantum conductance that equals 2e2/h.) to avoid the damage of the graphene electrodes. The top right inset is the relative displacement distribution ranging from 3.2 × 10⁻⁴ to 4.0 × 10⁻⁶ G0. d One-dimensional conductance histogram of graphene/single-C60, C70, C76, C90/graphene junctions and blank experiments. e Conductance of the graphene/single-fullerene/graphene junctions and the highest occupied molecular orbital–lowest unoccupied molecular orbital gap values of fullerenes vs. the number of carbon atoms in fullerenes

