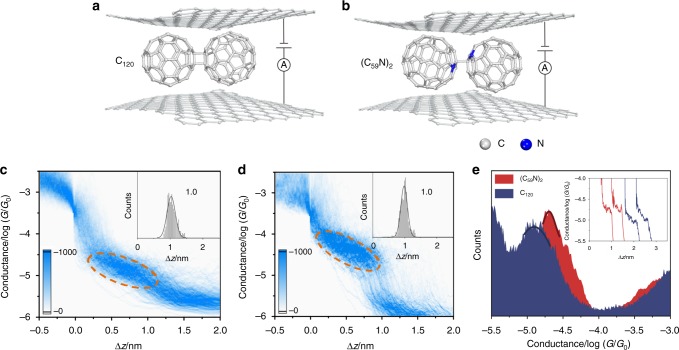
Fig. 3.
Heteroatoms doping in graphene/single-fullerene/graphene junctions. a, b Schematic of graphene/single-C120 (a) and (C59N)2 (b)/graphene junctions. c, d Corresponding two-dimensional conductance histogram obtained from ~1000 traces of C120 (c) and (C59N)2 (d). The top right inset is the relative displacement distribution (The conductance range to determine the displacement of C120 and (C59N)2 are from 3.2 × 10⁻⁴ to 4.0 × 10⁻⁶ G0, 1.0 × 10⁻⁵ G0, respectively.). e Ono-dimensional conductance histogram of the graphene/single-fullerene/graphene junctions composed of C120 and (C59N)2. The top right inset is the individual conductance–displacement curves

