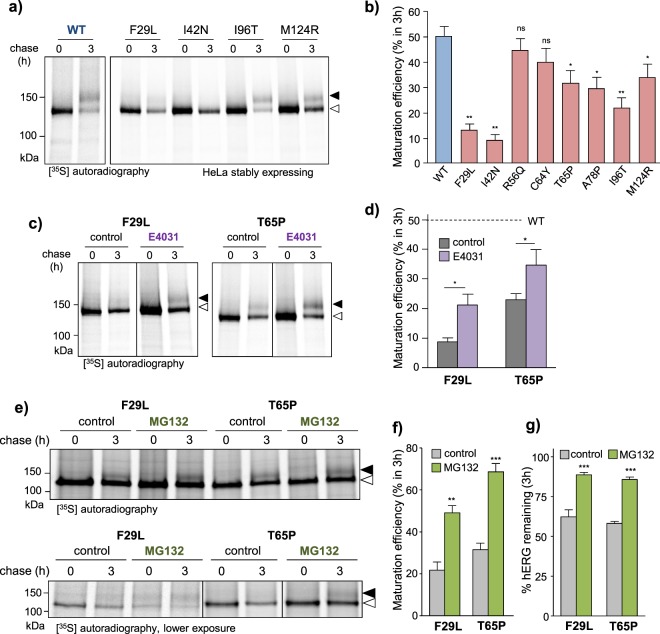
Figure 2.
Maturation efficiency and proteasomal degradation of PAS-mutants at the ER. (a) Subset of PAS mutants are recognized by the ER QC machinery. Nascent hERG synthesized at the ER were pulse-labeled with [35S]-methionine/cysteine and chased for 3 h. hERG was isolated by immunoprecipitation and detected by autoradiography. Mature complex-glycosylated (~155 kDa) and ER-resident core-glycosylated (~135 kDa) hERG indicated by solid and empty arrows, respectively. (b) Quantification of WT and select PAS mutant HERG maturation efficiencies. Maturation efficiency calculated as described in Materials and Methods. (c,d) Pharmacological correction of PAS-mutant folding improves ER processing. Maturation efficiency of T65P and F29L mutant hERG measured by metabolic pulse-chase in the presence of 10 µM E4031. Maturation efficiency calculated as described in Materials and Methods. Mature complex-glycosylated (~155 kDa) and ER-resident core-glycosylated (~135 kDa) hERG indicated by solid and empty arrows, respectively. (e–g) PAS-mutants are subject to proteasome-dependent ERAD. Maturation efficiency and metabolic turnover of nascent T65P and F29L mutant hERG measured by metabolic pulse-chase in the presence or absence of proteasomal inhibitor MG132 (10 µM). Maturation efficiency calculated as in (b). Turnover expressed as % total (mature + immature) radiolabeled hERG remaining after 3 h chase. *P < 0.05, **P < 0.01, ***P < 0.001, n.s. indicates no significant difference (See Methods for explanation of statistical analysis). Representative images shown (uncropped images in Supplementary Fig. S12). Solid line: different parts of the same autoradiogram. White space: separate autoradiograms.

