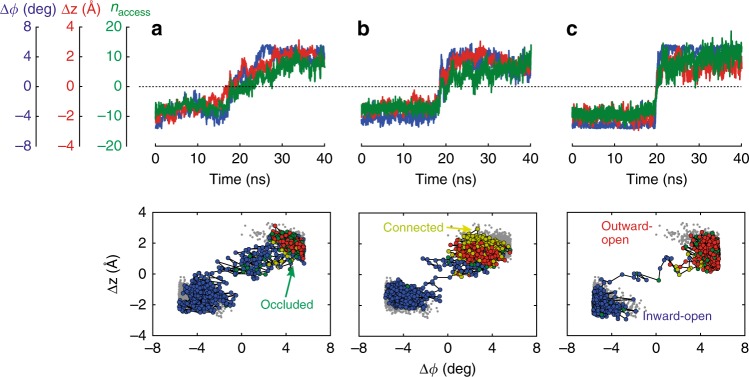
Fig. 2.
Proton- and sodium-transport transition paths. Representative transition paths for a H+ transport and b Na+ transport at 37 °C, and c Na+ transport at 100 °C. The transition-path trajectories are projected onto the two order parameters for rotation and translation of the six-helix-bundle motion, Δϕ and Δz. (Top) Time series of the structural order parameters (blue: Δϕ; red: Δz), and the hydration order parameter naccess (green). (Bottom) Projection of equilibrium runs (gray) and transition paths onto the Δϕ - Δz plane. Inward-open, occluded, connected, and outward-open states are shown as blue, green, yellow, and red points, respectively

