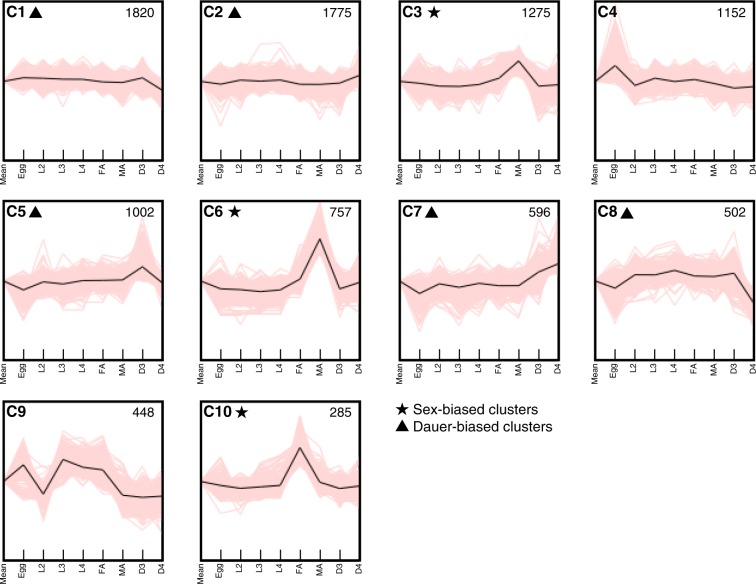
Figure 4.
Clustering analysis of genes differentially expressed between developmental stages. A total of 9612 genes are clustered into 10 (C1 to C10) based on expression dynamics by K-means clustering. The upper-left alphanumeric values designate the number of the cluster. Sex-biased and dauer-biased clusters were indicated by stars and triangles, respectively. The upper-right values in each cluster shows cluster size (number of genes). Black lines indicate representative transcriptional expressions.

