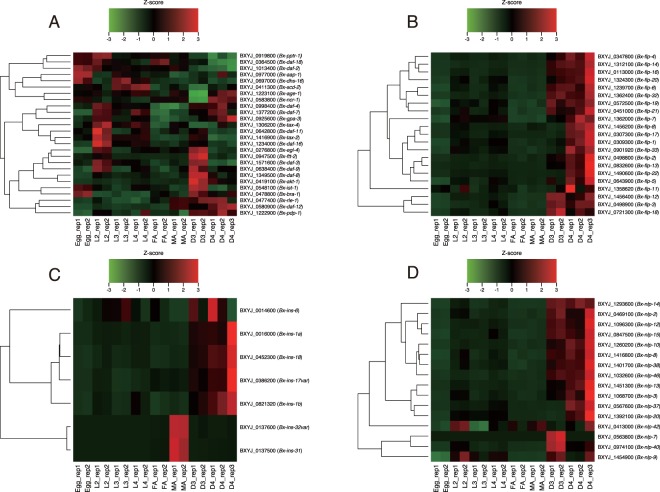
Figure 5.
Gene expression patterns of dauer-related genes and neuropeptide genes. Heatmaps represent expression dynamics of B. xylophilus orthologues of (A) C. elegans dauer genes and neuropeptide (B) flp, (C) ins and (D) nlp genes. Rows represent genes “B. xylophilus gene ID (C. elegans gene name or B. xylophilus gene name)” and columns represent RNA-seq samples. The intensity of each colour denotes the standardized ratio between each value and the average expression of each gene across all samples. Genes showing null FPKM in all stages were removed from the plot.

