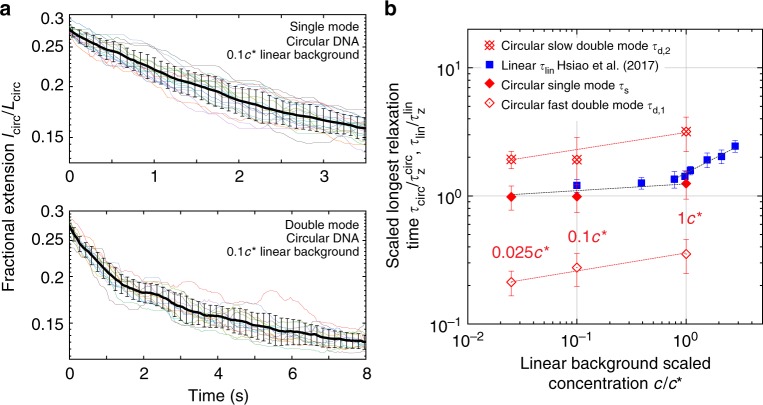
Fig. 2.
Relaxation of single ring polymers in semidilute linear polymer solutions. a Single molecule relaxation trajectories and average relaxation for molecular subpopulations corresponding to (top) single-mode and (bottom) double-mode exponential relaxation trajectories for ring polymers in a background solution of 0.1 c* linear chains. Black curves with error bars (standard deviation) denote the ensemble averaged relaxation trajectory, and the solid thin curves (color) correspond to single molecule relaxation trajectories. Molecular ensembles consist of n = 18 molecules for single-mode relaxation and n = 13 molecules for double-mode relaxation at 0.1 c*. b Longest relaxation times (normalized to dilute solution values) for circular (red diamonds) and linear polymers (blue squares) in semidilute unentangled linear solutions as a function of scaled concentration c/c*. Source data are provided as a Source Data file

