Fig. 3.
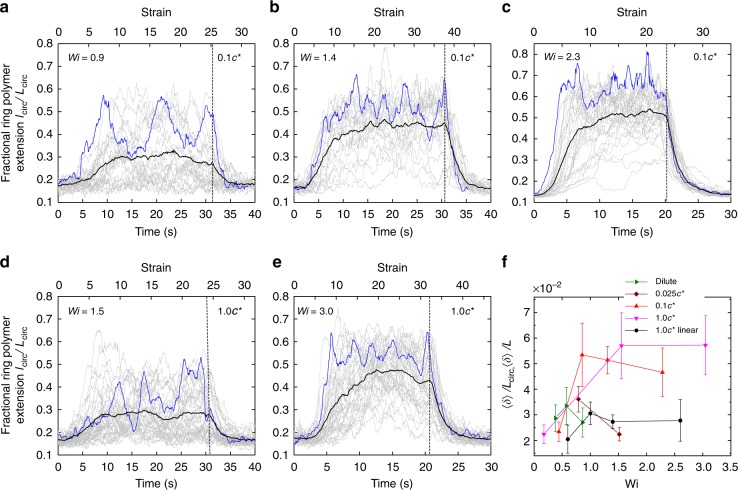
Single molecule trajectories of ring polymers show large conformational fluctuations. Transient fractional extension of ring DNA polymers in semidilute unentangled linear solutions with concentrations of 0.1 c* at a Wi = 0.9, b Wi = 1.4, and c Wi = 2.3, and background linear chain concentration of 1.0 c* at d Wi = 1.5, and e)Wi = 3.0. Individual single molecule trajectories are shown in gray lines and ensemble averaged trajectories are shown in a black line. A characteristic individual single molecule trajectory is highlighted in blue line. Molecular ensembles consist of n = 24, n = 25, and n = 33 molecules, respectively for Wi = 0.9, 1.4, and 2.3 at 0.1 c*, and n = 38 for both Wi = 1.5 and Wi = 3.0 at 1.0 c*. The dashed line indicates the time at which the step strain input is stopped. f Magnitude of ring polymer conformational fluctuations as a function of Wi, plotted as average fractional fluctuation values, such that average chain extension fluctuations 〈δ〉 are normalized by the contour length of ring polymers Lcirc and linear polymers L, respectively. Data for ring polymers in dilute solution, 0.025 c* linear semidilute solution, 0.1 c* linear semidilute solution, and 1.0 c* linear semidilute solution are denoted as dark cyan right triangle, dark red diamond, red up triangle, and magenta down triangle, respectively. Data for 1.0 c* linear polymers (black circle) are taken from prior work33. Error bars represent standard deviation. Source Data are provided as a Source Data file

