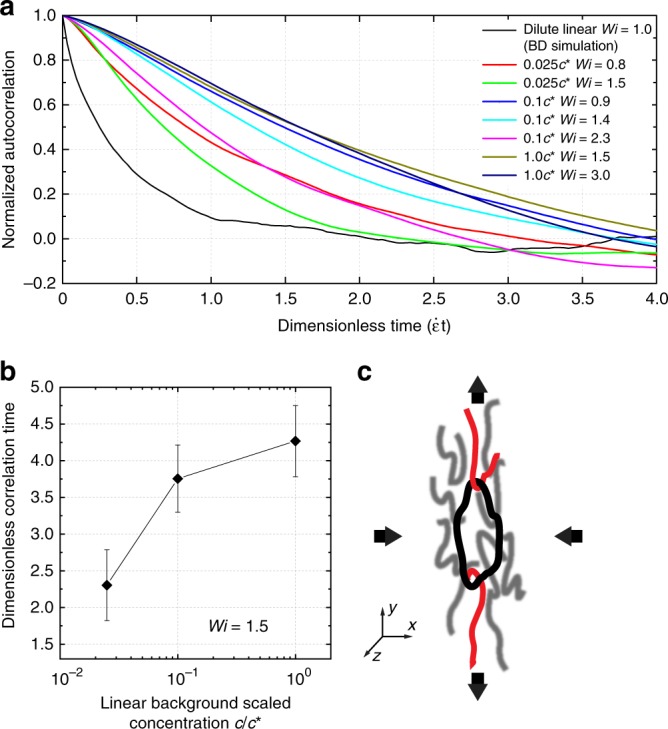
Fig. 6.

Quantitative analysis of ring polymer conformational fluctuations. a Autocorrelation of fluctuations in ring polymer extension as a function of Wi and background concentration after the initial transient phase. Molecular ensembles consist of n = 200 molecules for dilute linear chains (black solid line); n = 32 and n = 31 for Wi = 0.8 (red solid line) and Wi = 1.5 (green solid line) at 0.025 c*; n = 24, n = 25, and n = 33 for Wi = 0.9 (blue solid line), Wi = 1.4 (cyan solid line), and Wi = 2.3 (magenta solid line) at 0.1 c*; n = 38 for Wi = 1.5 (dark yellow solid line) and Wi = 3.0 (navy solid line) at 1.0 c*. b Characteristic correlation time (black diamond) of ring polymer fluctuations at Wi = 1.5 as a function of background solution concentration. Error bars represent standard deviation. Molecular ensembles consist of n = 31, n = 25, n = 38 molecules, respectively from 0.025 c* to 1.0 c*. c Schematic of two linear polymers threading into a ring polymer in planar extensional flow. Source Data are provided as a Source Data file
