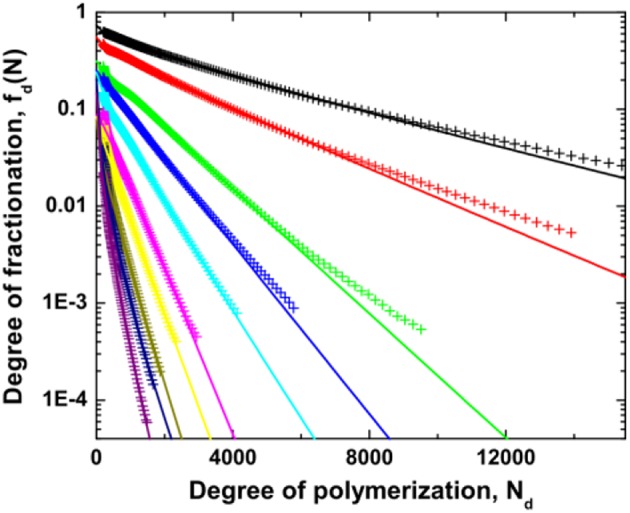
Figure 6.

Degree of fractionation fd(N) for dextran as a function of the degree of polymerization Nd of dextran for different values of the reduced polymer concentration which is varied from 0.01 (top right) to 0.73 (bottom left). The lines are fits to the data by the empirical relation . Reprinted from Zhao et al. (2016a), Copyright (2016), with permission from Elsevier.
