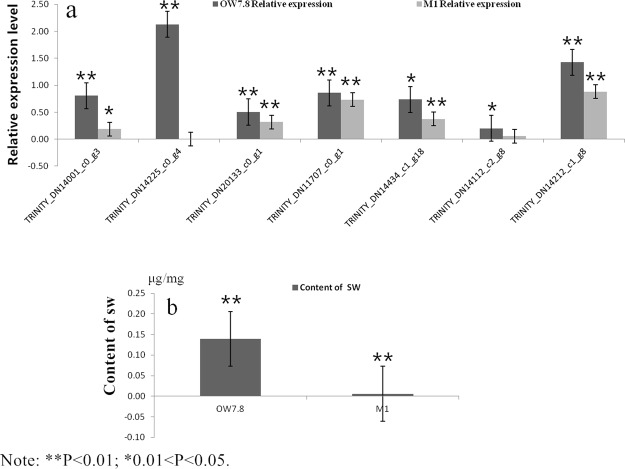
Figure 8.
Expression profiles of SW biosynthesis-related of 7 Unigenes in A. oxytropis. (a) Comparison of the expression levels of seven Unigenes with SW biosynthesis. The X axis represents seven Unigenes with SW biosynthesis. Columns and bars represent the means and standard error of three individual samples (Y axis). Each experiment was performed in triplicate. (b) Content of SW in 20d. The X axis represents OW7.8 and M1. Lines and bars represent the means and standard errors of three individual samples (Y axis). Each experiment was performed in triplicate.

