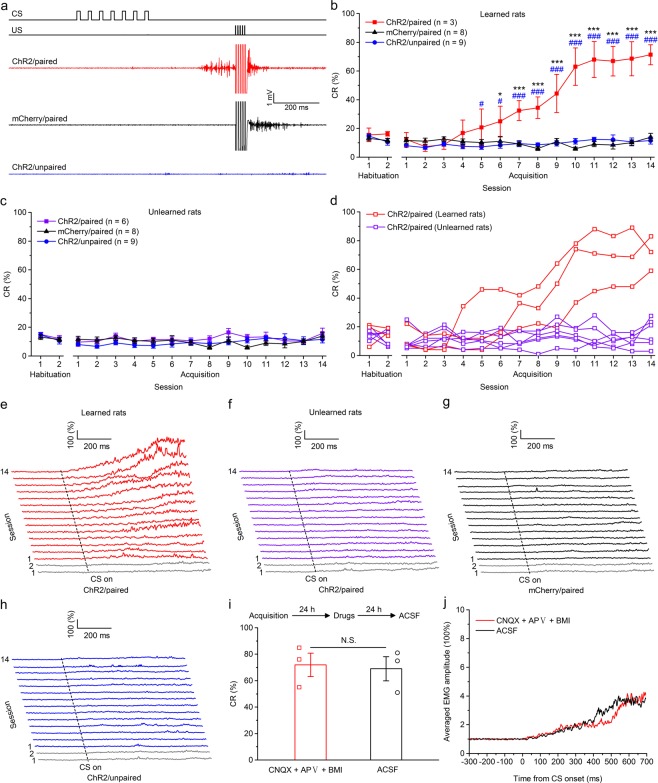
Figure 4.
Optogenetic stimulation of mossy fibers in the left MCP as a CS supports the acquisition of the TEC with a 350-ms trace interval. (a) Upper panel: the trace conditioning with a 350-ms trace interval paradigm illustrating the timing of the CS and US. Below panel: the representative O.O. EMG of the ChR2/paired, mCherry/paired, and ChR2/unpaired groups on the 14th conditioning session. (b,c) Average CR% for learned rats (b) and unlearned rats (c) in the ChR2/paired group, and all rats in mCherry/paired and ChR2/unpaired groups (* and # indicate significant differences between the ChR2/paired group and mCherry/paired and the ChR2/unpaired groups; ** or ##P < 0.01, *** or ###P < 0.001; 2-way ANOVA with repeated measures followed by Tukey post hoc test). (d) Individual learning curves of learned rats (red) and unlearned rats (violet) in ChR2/paired group. (e–h) EMG response topographies across two habituation and fourteen acquisition training sessions for learned rats (e) and unlearned rats (f) in the ChR2/paired group, and all rats in mCherry/paired (g) and ChR2/unpaired (h) groups. (i) CNQX, APV, and BMI administration did not affect the CR% of three learned rats (N.S., not significant, 2-tailed paired Student’s t-test). (j) The EMG response topographies for CNQX, APV, and BMI infusion or ACSF infusion were shown. Data are represented as mean ± s.e.m.

