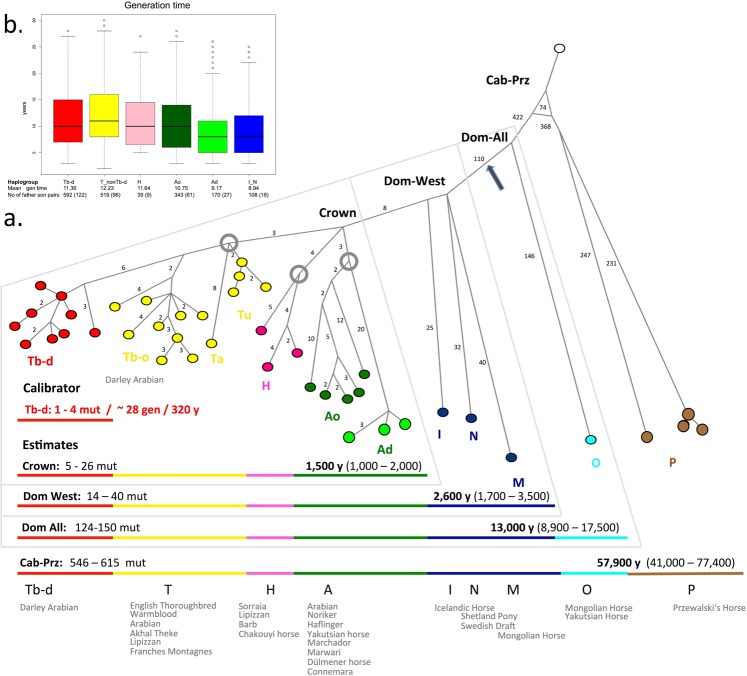
Figure 4.
Divergence time estimates. (a) Maximum parsimony tree rooted with the donkey. Coloured circles represent contemporary haplogroups; grey rings indicate basal HTs of the crowns’ sublines. The number of mutations on a branch is given on its left, unless it is one. In the lower panel the full range of mutations observed after respective coalescence points (mut) and years back to the MRCA (y) under the assumption of a mutation rate of 1.69 × 10⁻⁸ site/generation and assuming a generation interval from eight to twelve years (b) is shown. 95% highest posterior density intervals are given in brackets. The position of variant fBOI (indicative for Y-HT1 in Wutke et al.77) is marked by an arrow. Details on variants are given in Supplementary Table S8. (b) Mean generation intervals calculated from deep pedigrees from males genotyped for the respective haplogroup. The number of father-son pairs is given with genotyped individuals in parentheses (data in Supplementary Table S10).

