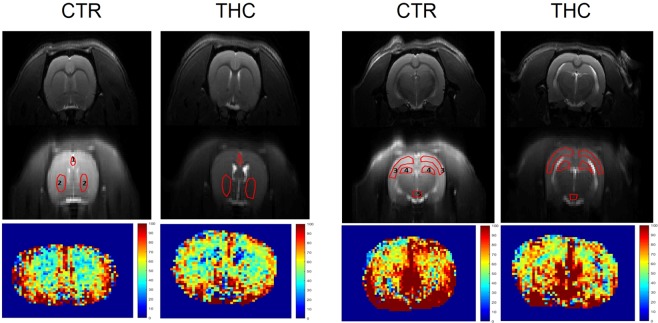
Figure 2.
ASL image in the THC model. The figure shows anatomical (T2 weighted) images in the top part, the delineation of regions of interest for the ASL analysis (central part) and perfusion map (bottom part) in one representative animal from each CTR and THC exposed group. ROIs are numbered as follows. At +1.6 mm position from bregma: 1 – prefrontal cortex, 2 – caudate putamen; at −3.14 mm position from bregma: 3 – sensorimotor cortex, 4 – hippocampus, 5 – circle of Willis.

