Fig. 1.
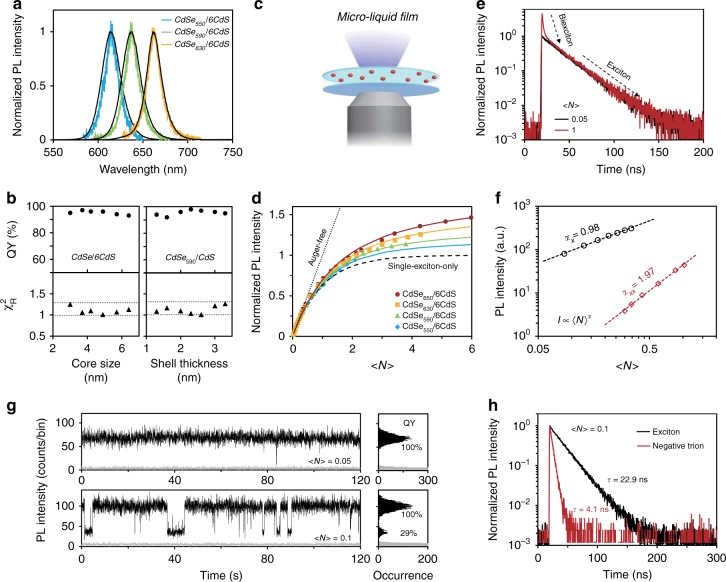
Optical properties of exciton, biexciton and trion for CdSe/CdS core/shell quantum dots (QDs). a Normalized photoluminescence (PL) spectra of representative single (color-coded) and the corresponding ensemble (black) QDs with different CdSe core sizes (the first-exciton absorption peak of CdSe core at 550, 590, and 630 nm, respectively) and six monolayers of CdS shell. b PL QYs and the goodness-of-fit (χR2) for mono-exponential fitting of PL decay curves for CdSe/CdS QDs with different core sizes or shell thicknesses. χR2 = 1.30 and 1.00 are represented by dotted lines. c Schematic of a micro-liquid film of QDs excited by a microscope objective. d Pump-power dependence of PL intensity for four representative QD samples with different core sizes but the same shell thickness measured by the micro-liquid film approach. Solid lines are the fits to the ‘PL saturation’’ model. The dashed and dotted lines are the PL saturation models with multi-exciton QY being 0% and 100%, respectively. e PL decay curves of CdSe630/6CdS core/shell QDs as an representative sample with low (black) and relatively high (red) excitation power measured by the micro-liquid film approach. f Excitation power dependence of PL intensity of single-exciton (black circles) and biexciton (red diamonds). The slopes in the log–log plot for both channels match the expected values. g Representative PL intensity trajectories (black) of CdSe630/6CdS core/shell QDs under different excitation power with background noises (gray) and the corresponding histograms. Bin time is 30 ms. h PL decay curves of the photons from the bright (black) and dim state (red) corresponding to e (<N> = 0.1)

