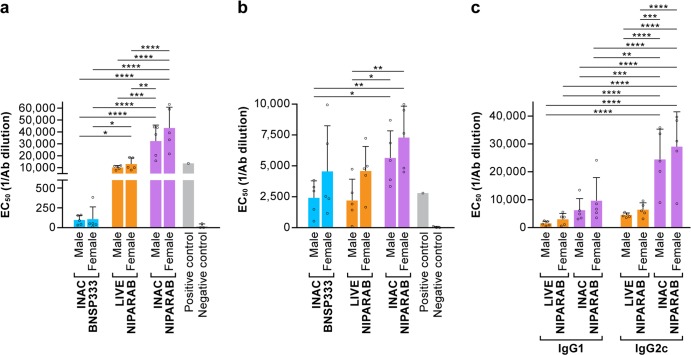
Fig. 5.
Analysis of terminal sera from NIPARAB immunized mice. a, b Average EC50 values (bars) were derived from ELISA curves measuring either total NiV G IgG (left panel) or RABV G (middle panel) from individual mice (open circles) from each vaccination group. Statistical significance was performed using 2-way ANOVA followed by uncorrected Fisher’s LSD to compare immunization groups (*p < 0.05, **p < 0.01, ***p < 0.001, ****p < 0.0001). c IgG1 and IgG2 isotype responses in final sera (day 45) from live or inactivated NIPARAB-immunized mice were assessed by ELISA at day 45 and average EC50 values (bars) were determined based on individual ELISA curves (open circles). Statistical significance was performed using 3-way ANOVA followed by uncorrected Fisher’s LSD test to compare immunization groups (*p < 0.05, **p < 0.01, ***p < 0.001, ****p < 0.0001). Error bars represent standard deviation from the mean of three replicate values

